Fibonacci/Lucas time series indicator for Amibroker (AFL)
vargasc1 about 15 years ago Amibroker (AFL)
August 2011 Traders Tips:
A ready-to-use, all-in-one formula for the article is presented here. To use it, enter the formula in the Afl Editor, then press “Insert indicator.”
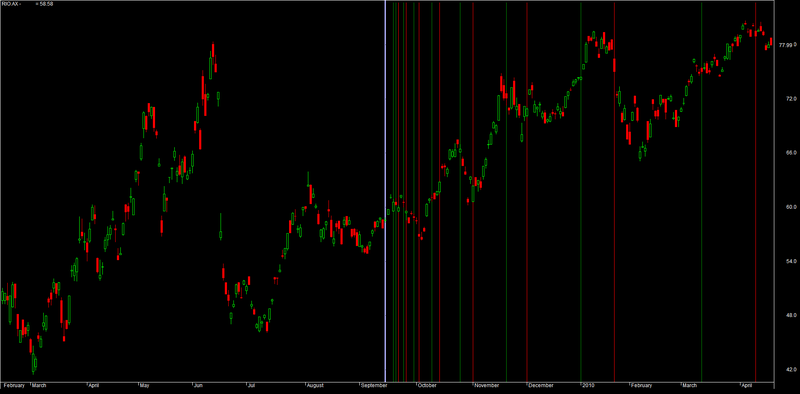
The starting point of a time series can be selected either by a mouse click on a chart or via the parameters window, which can also be used to define colors and determine which series should be plotted, Lucas or Fibonacci.
Screenshots
Indicator / Formula
Copy & Paste Friendly
function DrawSeries( start, series, Color )
{
  x = BarsSince( start );

  result = 0;

  for( i = 0; ( bar = StrToNum( StrExtract( series, i ) ) ) != 0; i++ )
  {
     result += x == bar;
  }

  Plot( result, "", Color,
        styleHistogram | styleOwnScale | styleNoLabel, 0, 1 );
}

Plot( C, "Price", colorBlack, styleCandle );

FibSeries = "5,8,13,21,34,55,89,144,233,377,610,987,1597,2584,4181,6765";
LucSeries = "3,4,7,11,18,29,47,76,123,199,322,521,843,1364,2207,3571";

dn = ParamDate("Date", "", 0 );
tn = ParamTime("Time", "00:00:00", 0 );

bi = BarIndex();

if( ParamToggle("Start point", "Mouse select|Date input", 0 ) )
start = DateNum() == dn AND TimeNum() == tn;
else
start = bi == SelectedValue( bi );

if( start[ BarCount -1 ] )
  Title = "Click on chart to select starting point or enter date in the Parameters window";

fibon = ParamToggle("Fib Series", "Off|On", 1 );
fibcolor = ParamColor("Fib Color", colorRed );

lucon = ParamToggle("Lucas Series", "Off|On", 1 );
luccolor = ParamColor("Lucas Color", colorGreen );

if( fibon ) DrawSeries( start, FibSeries, fibcolor );
if( lucon ) DrawSeries( start, LucSeries , luccolor );
1 comments
Leave Comment
Please login here to leave a comment.
sir great work