EMA crossover buy sell with BB Pivot trend line for Amibroker (AFL)
mehedi_reza almost 15 years ago Amibroker (AFL)
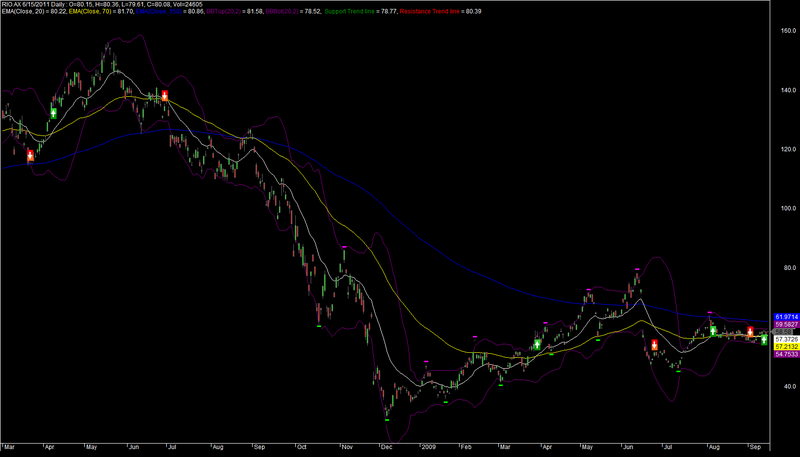
EMA crossover buy sell with BB Pivot trend line
Screenshots
Indicator / Formula
Copy & Paste Friendly
_SECTION_BEGIN("EMA20X200");

EMA20 = EMA(C, 20);
EMA70 = EMA(C, 70);
EMA150 = EMA(C, 200);

Buy = Cross(EMA20, EMA70);
Sell = Cross(EMA70, EMA20);

Filter = Buy OR Sell;
Buy = ExRem(Buy, Sell);
Sell =ExRem(Sell, Buy);

trigger = WriteIf(Buy, "BUY", WriteIf(Sell, "SELL", " "));
fg = IIf(Buy, colorDarkGreen, IIf(Sell, colorRed, colorDefault));
bg = IIf(Buy, colorPaleGreen, IIf(Sell, colorPink, colorDefault));


_N(Title = StrFormat("{{NAME}} {{DATE}} {{INTERVAL}} : O=%1.2f, H=%1.2f, L=%1.2f, C=%1.2f, Vol=%1.0f\n{{VALUES}}", O, H, L, C, V));

if(Status("action") == actionIndicator)
	{
		PlotOHLC(O, H, L, C, "", colorGrey40, styleCandle);
		Plot(EMA20, "EMA(Close, 20)", colorWhite, styleLine);
       Plot(EMA70, "EMA(Close, 70)", colorYellow, styleLine);
		Plot(EMA150, "EMA(Close, 150)", colorBlue, styleLine);
		PlotShapes(IIf(Buy, shapeSquare, shapeNone),colorGreen, 0, L, Offset=-20);
		PlotShapes(IIf(Buy, shapeSquare, shapeNone),colorLime, 0,L, Offset=-10);
		PlotShapes(IIf(Buy, shapeUpArrow, shapeNone),colorWhite, 0,L, Offset=-15);
		PlotShapes(IIf(Sell, shapeSquare, shapeNone),colorRed, 0, H, Offset=20);
		PlotShapes(IIf(Sell, shapeSquare, shapeNone),colorOrange, 0,H, Offset=10);
		PlotShapes(IIf(Sell, shapeDownArrow, shapeNone),colorWhite, 0,H, Offset=-15);

	}

if(Status("action") == actionExplore)
	{
		SetOption("NodefaultColumns", True);

		AddTextColumn(Name(), "Symbol", 77, colorDefault, colorDefault, 120);
		AddColumn(DateTime(), "Date", formatDateTime, colorDefault, colorDefault, 96);
		AddTextColumn(trigger, "Signal", 77, fg, bg);
		AddColumn(C, "C. M. P.", 1.2, fg, colorDefault, 96);
	}


_SECTION_END();


_SECTION_BEGIN("BBands");
P = ParamField("Price field",-1);
Periods = Param("Periods", 20, 2, 300, 1 );
Width = Param("Width", 2, 0, 10, 0.05 );
Color = ParamColor("Color", colorViolet );
Style = ParamStyle("Style") | styleNoRescale | styleNoRescale;
Plot( BBandTop( P, Periods, Width ), "BBTop" + _PARAM_VALUES(), Color, Style );
Plot( BBandBot( P, Periods, Width ), "BBBot" + _PARAM_VALUES(), Color, Style );
_SECTION_END();


_SECTION_BEGIN("Pivot");
nBars = Param("Number of bars", 15, 5, 40);
LP=Param("LookBack Period",250,1,500,1);
bShowTCZ = Param("Show TCZ", 0, 0, 1);
nExploreBarIdx = 0;
nExploreDate = 0;
nCurDateNum = 0;
DN = DateNum();
DT = DateTime();
bTCZLong = False;
bTCZShort = False;
nAnchorPivIdx = 0;
ADX8 = ADX(8);
if(Status("action")==1) {
	bDraw = True;
	bUseLastVis = 1;
} else {
	bDraw = False;
	bUseLastVis = False;
	bTrace = 1;
	nExploreDate = Status("rangetodate");
	for (i=LastValue(BarIndex());i>=0;i--) {
		nCurDateNum = DN[i];
		if (nCurDateNum == nExploreDate) {
			nExploreBarIdx = i;
		}
	}
}
GraphXSpace=7;
if (bDraw) {
}
aHPivs = H - H;
aLPivs = L - L;
aHPivHighs = H - H;
aLPivLows = L - L;
aHPivIdxs = H - H;
aLPivIdxs = L - L;
aAddedHPivs = H - H;
aAddedLPivs = L - L;
aLegVol = H - H;
aRetrcVol = H - H;
nHPivs = 0;
nLPivs = 0;
lastHPIdx = 0;
lastLPIdx = 0;
lastHPH = 0;
lastLPL = 0;
curPivBarIdx = 0;
aHHVBars = HHVBars(H, nBars);
aLLVBars = LLVBars(L, nBars);
aHHV = HHV(H, nBars);
aLLV = LLV(L, nBars);
nLastVisBar = LastValue(
	Highest(IIf(Status("barvisible"), BarIndex(), 0)));
curBar = IIf(nlastVisBar > 0 AND bUseLastVis, nlastVisBar,
	IIf(Status("action")==4 AND nExploreBarIdx > 0, nExploreBarIdx,
	LastValue(BarIndex())));
curTrend = "";
if (aLLVBars[curBar] < aHHVBars[curBar])
	curTrend = "D";
else
	curTrend = "U";
if (curBar >= LP) {
	for (i=0; i<LP; i++) {
		curBar = IIf(nlastVisBar > 0 AND bUseLastVis,
			nlastVisBar-i,
			IIf(Status("action")==4 AND nExploreBarIdx > 0,
			nExploreBarIdx-i,
			LastValue(BarIndex())-i));
		if (aLLVBars[curBar] < aHHVBars[curBar]) {
			if (curTrend == "U") {
				curTrend = "D";
				curPivBarIdx = curBar - aLLVBars[curBar];
				aLPivs[curPivBarIdx] = 1;
				aLPivLows[nLPivs] = L[curPivBarIdx];
				aLPivIdxs[nLPivs] = curPivBarIdx;
				nLPivs++;
			}
		} else {
			if (curTrend == "D") {
				curTrend = "U";
				curPivBarIdx = curBar - aHHVBars[curBar];
				aHPivs[curPivBarIdx] = 1;
				aHPivHighs[nHPivs] = H[curPivBarIdx];
				aHPivIdxs[nHPivs] = curPivBarIdx;
				nHPivs++;
			}
		}
	}
}
curBar =
	IIf(nlastVisBar > 0 AND bUseLastVis,
	nlastVisBar,
	IIf(Status("action")==4 AND nExploreBarIdx > 0,
	nExploreBarIdx,
	LastValue(BarIndex()))
	);
if (nHPivs >= 2 AND nLPivs >= 2) {
	lastLPIdx = aLPivIdxs[0];
	lastLPL = aLPivLows[0];
	lastHPIdx = aHPivIdxs[0];
	lastHPH = aHPivHighs[0];
	nLastHOrLPivIdx = Max(lastLPIdx, lastHPIdx);
	nAddPivsRng = curBar - nLastHOrLPivIdx;
	aLLVAfterLastPiv = LLV(L, nAddPivsRng);
	nLLVAfterLastPiv = aLLVAfterLastPiv[curBar];
	aLLVIdxAfterLastPiv = LLVBars(L, nAddPivsRng);
	nLLVIdxAfterLastPiv = curBar - aLLVIdxAfterLastPiv[curBar];
	aHHVAfterLastPiv = HHV(H, nAddPivsRng);
	nHHVAfterLastPiv = aHHVAfterLastPiv[curBar];
	aHHVIdxAfterLastPiv = HHVBars(H, nAddPivsRng);
	nHHVIdxAfterLastPiv = curBar - aHHVIdxAfterLastPiv[curBar];
	if (lastHPIdx > lastLPIdx) {

		/*	There are at least two possibilities here. One is that
	   		the previous high was higher, indicating that this is a
	   		possible short retracement or one in the making.
	   		The other is that the previous high was lower, indicating
	   		that this is a possible long retracement in the working.
			However, both depend on opposing pivots. E.g., if I find
			higher highs, what if I have lower lows?

			If the highs are descending, then I can consider:
	   			- a lower low, and leave it at that
	   			- a higher high and higher low
	   			- a lower low and another lower high
		*/
		if (aHPivHighs[0] < aHPivHighs[1]) {

			if (nLLVAfterLastPiv < aLPivLows[0] AND
				(nLLVIdxAfterLastPiv - lastHPIdx - 1) >= 1
				AND nLLVIdxAfterLastPiv != curBar	) {

				// -- OK, we'll add this as a pivot.
				//    Mark it for plotting...
				aLPivs[nLLVIdxAfterLastPiv] = 1;
				aAddedLPivs[nLLVIdxAfterLastPiv] = 1;

				//    ...and then rearrange elements in the
				//    pivot information arrays
				for (j=0; j<nLPivs; j++) {
					aLPivLows[nLPivs-j] = aLPivLows[nLPivs-(j+1)];
					aLPivIdxs[nLPivs-j] = aLPivIdxs[nLPivs-(j+1)];
				}
				aLPivLows[0] = nLLVAfterLastPiv;
				aLPivIdxs[0] = nLLVIdxAfterLastPiv;
				nLPivs++;

			// -- Test whether to add piv given last piv is high
			//    AND we have lower highs
			}

		// -- Here, the last piv is a high piv, and we have
		//    higher-highs. The most likely addition is a
		//    Low piv that is a retracement.
		} else {

			if (nLLVAfterLastPiv > aLPivLows[0] AND
				(nLLVIdxAfterLastPiv - lastHPIdx - 1) >= 1
				AND nLLVIdxAfterLastPiv != curBar	) {

				// -- OK, we'll add this as a pivot.
				//    Mark it for plotting...
				aLPivs[nLLVIdxAfterLastPiv] = 1;
				aAddedLPivs[nLLVIdxAfterLastPiv] = 1;

				//    ...and then rearrange elements in the
				//    pivot information arrays
				for (j=0; j<nLPivs; j++) {
					aLPivLows[nLPivs-j] = aLPivLows[nLPivs-(j+1)];
					aLPivIdxs[nLPivs-j] = aLPivIdxs[nLPivs-(j+1)];
				}
				aLPivLows[0] = nLLVAfterLastPiv;
				aLPivIdxs[0] = nLLVIdxAfterLastPiv;
				nLPivs++;

			// -- Test whether to add piv given last piv is high
			//    AND we have lower highs
			}
		// -- The last piv is a high and we have higher highs
		//    OR lower highs
		}

	/* ****************************************************************
		Still finding missed pivot(s). Here, the last piv is a low piv.
	**************************************************************** */
	} else {

		// -- First case, lower highs
		if (aHPivHighs[0] < aHPivHighs[1]) {

			if (nHHVAfterLastPiv < aHPivHighs[0] AND
				(nHHVIdxAfterLastPiv - lastLPIdx - 1) >= 1
				AND nHHVIdxAfterLastPiv != curBar	) {

				// -- OK, we'll add this as a pivot.
				//    Mark that for plotting
				aHPivs[nHHVIdxAfterLastPiv] = 1;
				aAddedHPivs[nHHVIdxAfterLastPiv] = 1;

				//    ...and then rearrange elements in the
				//    pivot information arrays
				for (j=0; j<nHPivs; j++) {
					aHPivHighs[nHPivs-j] = aHPivHighs[nHPivs-(j+1)];
					aHPivIdxs[nHPivs-j] = aHPivIdxs[nhPivs-(j+1)];
				}
				aHPivHighs[0] = nHHVAfterLastPiv;
				aHPivIdxs[0] = nHHVIdxAfterLastPiv;
				nHPivs++;

			// -- Test whether to add piv given last piv is high
			//    AND we have lower highs
			}

		// -- Second case when last piv is a low piv, higher highs
		//    Most likely addition is high piv that is a retracement.
		//    Considering adding a high piv as long as it is higher
		} else {

			// -- Where I have higher highs,
			if (nHHVAfterLastPiv > aHPivHighs[0] AND
				(nHHVIdxAfterLastPiv - lastLPIdx - 1) >= 1
				AND nHHVIdxAfterLastPiv != curBar	) {

				// -- OK, we'll add this as a pivot.
				//    Mark it for plotting...
				aHPivs[nHHVIdxAfterLastPiv] = 1;
				aAddedHPivs[nHHVIdxAfterLastPiv] = 1;

				//    ...and then rearrange elements in the
				//    pivot information arrays
				for (j=0; j<nHPivs; j++) {
					aHPivHighs[nHPivs-j] = aHPivHighs[nHPivs-(j+1)];
					aHPivIdxs[nHPivs-j] = aHPivIdxs[nhPivs-(j+1)];
				}
				aHPivHighs[0] = nHHVAfterLastPiv;
				aHPivIdxs[0] = nHHVIdxAfterLastPiv;
				nHPivs++;

			// -- Test whether to add piv given last piv is high
			//    AND we have lower highs
			}

		}

	}

// -- If there are at least two of each
}

/* ****************************************
// -- Done with finding pivots
***************************************** */

if (bDraw) {

	// -- OK, let's plot the pivots using arrows


PlotShapes( IIf(aHPivs==1, shapeSmallSquare, shapeNone), colorCustom12, layer = 0, yposition = High, offset = 9);
PlotShapes( IIf(aHPivs==1, shapeSmallSquare, shapeNone), colorBlack, layer = 0, yposition = High, offset = 12);

PlotShapes( IIf(aAddedHPivs==1, shapeSmallSquare, shapeNone), colorCustom10,layer = 0, yposition = High, offset = 9);
PlotShapes( IIf(aAddedHPivs==1, shapeSmallSquare, shapeNone), colorBlack, layer = 0, yposition = High, offset = 12);

PlotShapes( IIf(aLPivs==1, shapeSmallSquare, shapeNone), colorBrightGreen, layer = 0, yposition = Low, offset = -9);
PlotShapes( IIf(aLPivs==1, shapeSmallSquare, shapeNone), colorBlack, layer = 0, yposition = Low, offset = -12);

PlotShapes( IIf(aAddedLPivs==1, shapeSmallSquare, shapeNone), colorYellow, layer = 0, yposition = Low, offset = -10);
PlotShapes( IIf(aAddedLPivs==1, shapeSmallSquare, shapeNone), colorBlack, layer = 0, yposition = Low, offset = -13);
}


/* ****************************************
// -- Done with discovering and plotting pivots
***************************************** */

// -- I'm going to want to look for possible retracement
risk = 0;
profInc = 0;
nLeg0Pts = 0;
nLeg0Bars = 0;
nLeg0Vol = 0;
nLeg1Pts = 0;
nLeg1Bars = 0;
nLeg1Vol = 0;
nLegBarsDiff = 0;
nRtrc0Pts = 0;
nRtrc0Bars = 0;
nRtrc0Vol = 0;
nRtrc1Pts = 0;
nRtrc1Bars = 0;
nRtrc1Vol = 0;

minRtrc = 0;
maxRtrc = 0;
minLine = 0;
maxLine = 0;
triggerLine = 0;
firstProfitLine = 0;
triggerInc = 0;
triggerPrc = 0;
firstProfitPrc = 0;
retrcPrc = 0;
retrcBar = 0;
retrcBarIdx = 0;
retrcRng = 0;
aRetrcPrc = H-H;
aRetrcPrcBars = H-H;
aRetrcClose = C;
retrcClose = 0;

// -- Do TCZ calcs. Arrangement of pivs very specific
//    for this setup.
if (nHPivs >= 2 AND
	nLPivs >=2 AND
	aHPivHighs[0] > aHPivHighs[1] AND
	aLPivLows[0] > aLPivLows[1]) {

	tcz500 =
	(aHPivHighs[0] -
	(.5 * (aHPivHighs[0] - aLPivLows[1])));

	tcz618 =
	(aHPivHighs[0] -
	(.618 * (aHPivHighs[0] - aLPivLows[1])));

	tcz786 =
	(aHPivHighs[0] -
	(.786 * (aHPivHighs[0] - aLPivLows[0])));

	retrcRng = curBar  - aHPivIdxs[0];
	aRetrcPrc = LLV(L, retrcRng);
	aRetrcPrcBars  = LLVBars(L, retrcRng);

	retrcPrc = aRetrcPrc[curBar];
	retrcBarIdx = curBar - aRetrcPrcBars[curBar];
	retrcClose = aRetrcClose[retrcBarIdx];

	// -- bTCZLong setup?
	bTCZLong = (

		// -- Are retracement levels arranged in
		//    tcz order?

		// .500 is above .786 for long setups
		tcz500 >= (tcz786 * (1 - .005))
		AND
		// .681 is below .786 for long setups
		tcz618 <= (tcz786 * (1 + .005))
		AND

		// -- Is the low in the tcz range
		// -- Is the close >= low of tcz range
		//    and low <= high of tcz range
		retrcClose >= ((1 - .01) *  tcz618)
		AND
		retrcPrc <= ((1 + .01) *  tcz500)
		);

		// -- risk would be high of signal bar minus low of zone
		//risk = 0;

// -- lower highs and lower lows
} else if (nHPivs >= 2 AND nLPivs >=2
	AND aHPivHighs[0] < aHPivHighs[1]
	AND aLPivLows[0] < aLPivLows[1]) {

	tcz500 =
	(aHPivHighs[1] -
	(.5 * (aHPivHighs[1] - aLPivLows[0])));

	tcz618 =
	(aHPivHighs[0] -
	(.618 * (aHPivHighs[1] - aLPivLows[0])));

	tcz786 =
	(aHPivHighs[0] -
	(.786 * (aHPivHighs[0] - aLPivLows[0])));

	retrcRng = curBar  - aLPivIdxs[0];
	aRetrcPrc = HHV(H, retrcRng);
	retrcPrc = aRetrcPrc[curBar];
	aRetrcPrcBars  = HHVBars(H, retrcRng);
	retrcBarIdx = curBar - aRetrcPrcBars[curBar];
	retrcClose = aRetrcClose[retrcBarIdx];

	bTCZShort = (
		// -- Are retracement levels arranged in
		//    tcz order?

		// .500 is below .786 for short setups
		tcz500 <= (tcz786 * (1 + .005))
		AND
		// .681 is above .786 for short setups
		tcz618 >= (tcz786 * (1 - .005))
		AND

		// -- Is the close <= high of tcz range
		//    and high >= low of tcz range
		retrcClose <= ((1 + .01) *  tcz618)
		AND
		retrcPrc >= ((1 - .01) *  tcz500)
		);

		// -- Risk would be top of zone - low of signal bar
		//risk = 0;
}

// -- Show zone if present
if (bTCZShort OR bTCZLong) {

	// -- Be prepared to see symmetry
	if (bTCZShort) {
		if (aLPivIdxs[0] > aHPivIdxs[0]) {
			// -- Valuable, useful symmetry information
			nRtrc0Pts = aHPivHighs[0] - aLPivLows[1];
			nRtrc0Bars = aHPivIdxs[0] - aLPivIdxs[1] + 1;
			nRtrc1Pts = retrcPrc - aLPivLows[0];
			nRtrc1Bars = retrcBarIdx - aLPivIdxs[0] + 1;
		} else {
			nRtrc0Pts = aHPivHighs[1] - aLPivLows[1];
			nRtrc0Bars = aHPivIdxs[1] - aLPivIdxs[1] + 1;
			nRtrc1Pts = aHPivHighs[0] - aLPivLows[0];
			nRtrc1Bars = aHPivIdxs[0] - aLPivIdxs[0] + 1;
		}
	} else { // bLongSetup
		if (aLPivIdxs[0] > aHPivIdxs[0]) {
			nRtrc0Pts = aHPivHighs[0] - aLPivLows[1];
			nRtrc0Bars = aHPivIdxs[0] - aLPivIdxs[1] + 1;
			nRtrc1Pts = retrcPrc - aLPivLows[0];
			nRtrc1Bars = retrcBarIdx - aLPivIdxs[0] + 1;
		} else {
			nRtrc0Pts = aHPivHighs[1] - aLPivLows[0];
			nRtrc0Bars = aLPivIdxs[0] - aHPivIdxs[1] + 1;
			nRtrc1Pts = aHPivHighs[0] - aLPivLows[0];
			nRtrc1Bars = aLPivIdxs[0] - aHPivIdxs[0] + 1;
		}
	}

	if (bShowTCZ) {
		Plot(
			LineArray(	IIf(bTCZLong, aHPivIdxs[0], aLPivIdxs[0]),
			tcz500, curBar, tcz500 , 0),
			"tcz500", colorPaleBlue, styleLine);
		Plot(
			LineArray(	IIf(bTCZLong, aHPivIdxs[0], aLPivIdxs[0]),
			tcz618, curBar, tcz618, 0),
			"tcz618", colorPaleBlue, styleLine);
		Plot(
			LineArray(	IIf(bTCZLong, aHPivIdxs[0], aLPivIdxs[0]),
			tcz786, curBar, tcz786, 0),
			"tcz786", colorTurquoise, styleLine);
	}

// -- if (bShowTCZ)
}


// **************************
// END INDICATOR CODE
// **************************
_SECTION_END();


/*++++++++++++++++++++++++++++++++++++++++++++++++++++++++++++++++++++++++++++++++++++++++++++++++++++++++++++
	THIS SECTION DRAWS TD TREND LINES */

percent  = 0.01 * 1; /* Adjust this percent as necessary, I use .01 because FOREX is a 0.0000 number */
firstpointL = 2;
firstpointH = 2;

y0=LastValue(Trough(L,percent,firstpointL));
y1=LastValue(Trough(Ref(L,-1),percent,1));

for( i = 1; i < BarCount AND y0 >= y1; i++ )
{

		firstpointL++;
		y0=LastValue(Trough(L,percent,firstpointL));
}

x0=BarCount - 1 - LastValue(TroughBars(L,percent,firstpointL));
x1=BarCount - 1 - LastValue(TroughBars(Ref(L,-1),percent,1));
LineL = LineArray( x0, y0, x1, y1, 1 );
/*
Plot(C, "C", colorBlack, styleCandle);
*/
Plot( LineL, " Support Trend line", colorGreen,4 +8 );


yt0=LastValue(Peak(H,percent,firstpointH));
yt1=LastValue(Peak(Ref(H,-1),percent,1));

for(i = 1; i < BarCount AND yt0 <= yt1; i++ )
{

		firstpointH++;
		yt0=LastValue(Peak(H,percent,firstpointH));
}
xt0=BarCount - 1 - LastValue(PeakBars(H,percent,firstpointH));
xt1=BarCount - 1 - LastValue(PeakBars(Ref(H,-1),percent,1));
LineH = LineArray( xt0, yt0, xt1, yt1, 1 );

Plot( LineH, "Resistance Trend line", colorRed,4 + 8 );
3 comments
Leave Comment
Please login here to leave a comment.
very good. tnx
This very AFL, Amibroker completly jam, totally not funtioning, please rectify or remove
This indicator is actually working…give some time to understand it thanx