Gann Cardinals for Amibroker (AFL)
extremist almost 15 years ago Amibroker (AFL)
CODE IS BASED ON ACTUAL GANN SQUARE OF NINE. AND VERY HELPFULL
IN PLOTTING THOSE GANN CARDINAL LINES ON PRICE CHART.
- Enter the LTP (last traded price) or WAP (weighed average price) of any stock / index/ future anytime during the market hours.
- The ideal time is 15min – 1hr after market opens.
- If you are unable to find the WAP, you can also enter last traded price of the stock / underlying. and see the results.
You can set ur own no. of rounds in Gann Square by varying the other parameters
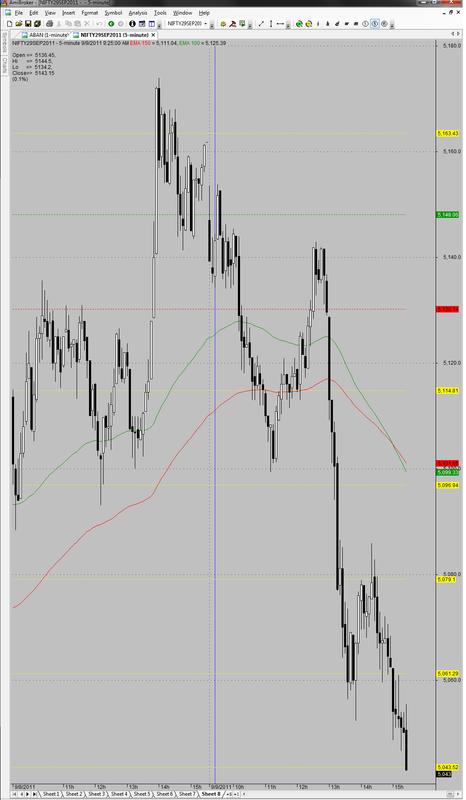
Screenshots
Indicator / Formula
Copy & Paste Friendly
a=Param("Price",5143,1,6000,1);

m=0.125;

b=a^(1/2);

x2=floor(b);
x1=x2-1;
x3=x2+1;

// Generating Gann Square //

for(i=1;i<=8;i++)
{
	   g[i]=(x1+m*i)^2;

}

for(i=9;i<=16;i++)
{
		j=i-8;
	   g[i]=(x2+m*j)^2;

}

for(i=17;i<=24;i++)
{
		k=i-16;
	   g[i]=(x3+m*k)^2;

}

// Plotting gann lines //

for(m=2;m<=24;m++)
{
		if((g[m]<=a)AND(g[m+1]>a))
          {   z=m;
				t=Param("Resistance Step No.",1,1,24,1);
				u=Param("Support Step No.",1,1,z,1);

				Plot(g[z],"",colorRed,styleDashed);

			// Go short bellow red line with stop loss at green line and for targets look at the support lines //

				Plot(g[z+1],"",colorGreen,styleDashed);

			// Go long above green line with stop loss at red line and for targets look at the resistance lines //


				for(n=z+2;n<=z+1+t;n++)
					{	g[n]=g[n]*0.9995;
						Plot(g[n],"",colorYellow,styleDashed);
					}

				for(n=z-1;n>=z-u;n--)
					{	g[n]=g[n]*1.0005;
						Plot(g[n],"",colorYellow,styleDashed);
					}
             }


}
5 comments
Leave Comment
Please login here to leave a comment.
Put a starting value of 100 and at 360 degrees you should get 110 which is not the case. There are Gann So9 templates on the intenet where you can check your values.
brother i chacked it and it is perfectly fine. u r suppose to enter the price after 30 min. of mkt opening. as price in formula. and it will produce the cardinal values on price chart.
plz chk once again
ichked with value 100 and produced right results!
http://imageshack.us/photo/my-images/153/95581377.png/
u can see urself. i’ve uploaded the image.
Hi extremist, i like the formula very much, it works for me. Does the formula work for forex also?
How can i adjust the formula for forex?
And another question, is it possible to make automatic gann cardinals with this formula?
hi rohit
im not able to see any chart with above AFL please help
down