Stock Portfolio Organizer

The ultimate porfolio management solution.

Shares, Margin, CFD's, Futures and Forex
EOD and Realtime
Dividends and Trust Distributions
And Much More ....
For Portfolio Manager Click Here

WiseTrader Toolbox

#1 Selling Amibroker Plugin featuring:

Advanced Adaptive Indicators
Advanced Pattern Exploration
Neural Networks
And Much More ....
Find Out More Here

Near Day High & Low finder for Amibroker (AFL)
priya
over 12 years ago
Amibroker (AFL)

Rating:
3 / 5 (Votes 2)
Tags:
amibroker, exploration, timeframe

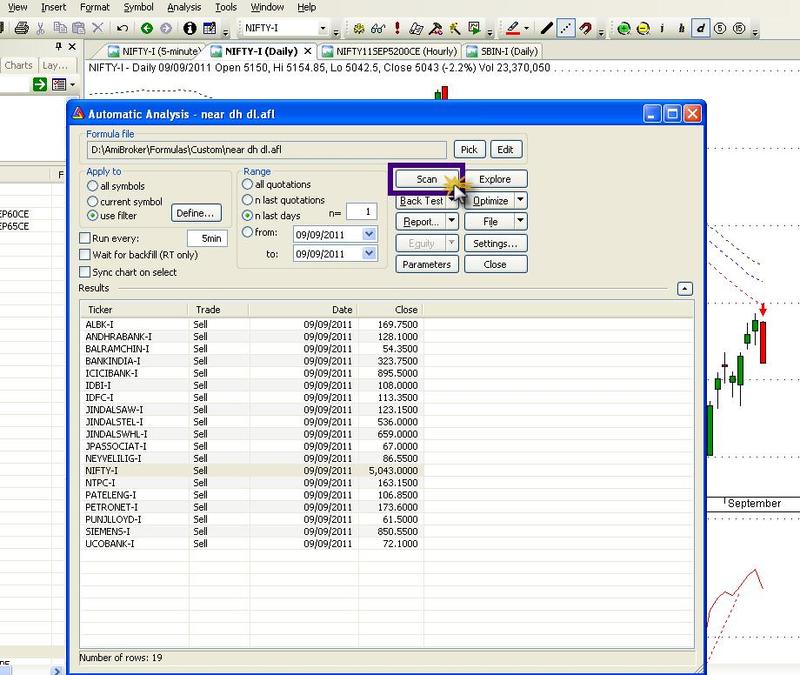
Scans stocks which are trading very very close to days High or Days Low. You will get them in advance before they make new high or low

Screenshots

Similar Indicators / Formulas

Pattern Correlation
Submitted by vargasc1 almost 13 years ago
export data out of files
Submitted by kilroy0514 almost 13 years ago
Deel - Average Dollar Price Volatility
Submitted by kaiji over 14 years ago
Wavetrend scanner
Submitted by taxxghost over 11 years ago
10 % return by 15 day uptrend exploration
Submitted by mayur_a14 almost 13 years ago

Indicator / Formula

Copy & Paste Friendly
TimeFrameSet(inDaily);
H1 = HHV(H, 1) ;

H2= (H1-C)< .001*C;

L1 = LLV(L,1) ;


L2 = (C-L1) < .001*C ;

TimeFrameRestore() ;

SetOption("NoDefaultColumns", True);

AddTextColumn(Name(), "Symbol");
AddColumn(DateTime(), "Date", formatDateTime);
AddColumn(C, "CMP", 1.2);


Filter = H2 OR L2 ;

Plot(H2,"",colorBlue,styleDashed);
Plot(L2,"",4,styleDashed);

Buy = H2 ;
Sell = L2 ;

PlotShapes( Buy * shapeUpArrow + Sell * shapeDownArrow, IIf( Buy, colorYellow, colorYellow ) );

2 comments

1. target1cr

good one.

2. classy

very good .thanks a lot

Leave Comment

Please login here to leave a comment.

Back