Gap Up and Down for Amibroker (AFL)
davidalan almost 15 years ago Amibroker (AFL)
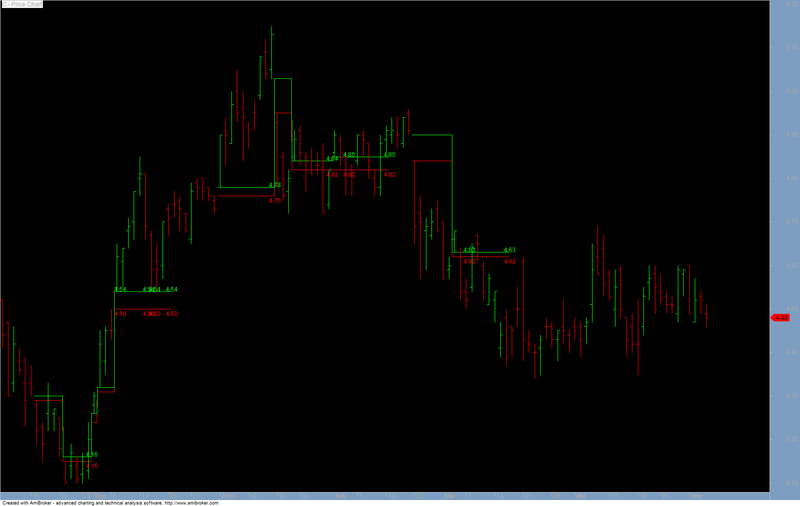
Shows gaps up and down can give ideas on support and resistance areas credit to m potlach
Screenshots
Indicator / Formula
Copy & Paste Friendly
_SECTION_BEGIN( "Background Color" );
BKswitch = ParamToggle( "Background Color", "On,Off" );

OUTcolor = ParamColor( "Outer Panel Color", colorLightBlue );
INUPcolor = ParamColor( "Inner Panel Upper", colorBlack );
INDNcolor = ParamColor( "Inner Panel Lower", colorBlack );
TitleColor = ParamColor( "Title Color ", ColorRGB( 245, 245, 245 ) );

if( NOT BKswitch )
{
    SetChartBkColor( OUTcolor ); // color of outer border
    SetChartBkGradientFill( INUPcolor, INDNcolor, TitleColor ); // color of inner panel
}

_SECTION_END();

Gup = L > Ref( H, -1 );
Gdn = H < Ref( L, -1 );
Gap = Gup OR Gdn;
LinLen = Param( "Gap Line length", 10, 1, 100, 1 );
ShowLine = BarsSince( Gup OR Gdn ) < LinLen;
TextPos = Showline < Ref( ShowLine, -1 );
GapUpHi = IIf( ShowLine, ValueWhen( Gup, Ref( H, -1 ) ), Null );
GapUpLo = IIf( ShowLine, ValueWhen( Gup, L ), Null ); // OK
GapDnHi = IIf( ShowLine, ValueWhen( GDn, Ref( L, -1 ) ), Null ); // OK
GapDnLo = IIf( ShowLine, ValueWhen( GDn, H ), Null );
GapLineHi = IIf( ShowLine, ValueWhen( Gap, IIf( Gup, L, IIf( GDn, Ref( L, -1 ), Null ) ) ), Null );
GapLineLo = IIf( ShowLine, ValueWhen( Gap, IIf( Gdn, H, IIf( Gup, Ref( H, -1 ), Null ) ) ), Null );
Plot( C, "", colorBlack, styleBar );
Plot( GapLineHi, "", 5, styleStaircase );
Plot( GapLineLo, "", 4, styleStaircase );
FirstVisibleBar = Status( "FirstVisibleBar" );
Lastvisiblebar = Status( "LastVisibleBar" );

for( b = Max( LinLen, Firstvisiblebar ); b <= Lastvisiblebar AND b < BarCount; b++ )
{
    if( Gap[b - LinLen + 1] )
    {
        PlotText( NumToStr( GapLineHi[b], 1.2 ), b, GapLineHi[b], 5 );
        PlotText( "\n" + NumToStr( GapLineLo[b], 1.2 ), b, GapLineLo[b], 4 );
    }
}
4 comments
Leave Comment
Please login here to leave a comment.
@admin sir how to use this system ??
Not sure try googling ‘Gap Trading’
@admin thanks sir.
tanks your effort, How I only show gap with rate of change lager than 5%