Color Bollinger Bands for Amibroker (AFL)
bobylam almost 15 years ago Amibroker (AFL)
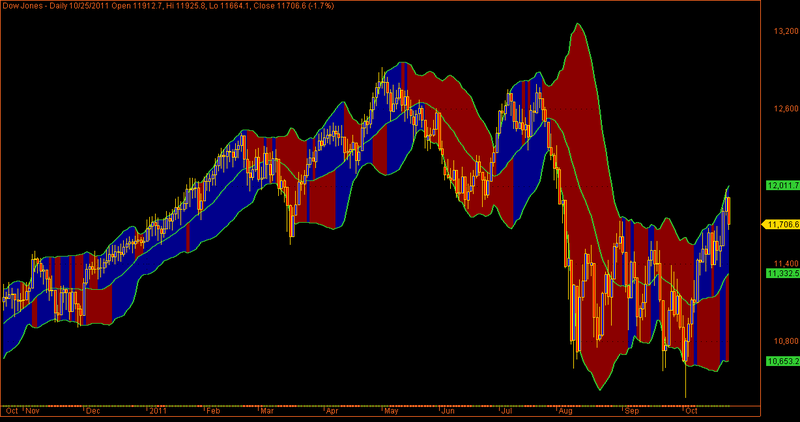
Cloud color for bollinger band:
If all 3 lines are up, green color cloud in whole BB.If upper 2 lines are pointing up, green color cloud should be in upper half BB.
If all 3 lines are down, red color cloud in whole BB.If lower 2 lies are down I need red color cloud in lower half BB.
link:
http: // w w w . t raderji.com/amibroker/61316-cloud-coding-help-required.html
Screenshots
Indicator / Formula
Copy & Paste Friendly
_SECTION_BEGIN("Colorf Bollinger Bands");
P = ParamField("Price field",-1);
Period = Param("Short Periods", 20, 15, 30, 1 );
Width = Param("Short Width", 2, 1, 10, 1 );

TopCond=BBandTop( P, Period, Width )>Ref(BBandTop( P, Period, Width ),-1);
MidCond=MA(C,Period)>Ref(MA(C,Period),-1);
BotCond=BBandBot( P, Period, Width )>Ref(BBandBot( P, Period, Width ),-1);


UpColor=IIf(TopCond AND MidCond,colorDarkBlue,colorDarkRed);
DownColor=IIf(MidCond AND BotCond,colorDarkBlue,colorDarkRed);

PlotOHLC(BBandTop( P, Period, Width ),BBandTop( P,Period, Width ),MA(C,Period),MA(C,Period), "", UpColor, styleCloud+styleNoLabel+styleNoTitle, Null, Null, Null, -2 );
PlotOHLC(MA(C,Period),MA(C,Period),BBandBot( P, Period, Width ),BBandBot( P, Period, Width ), "", DownColor, styleCloud+styleNoLabel+styleNoTitle, Null, Null, Null, -2 );

Plot(BBandBot( P, Period, Width ),"",colorLime,styleThick+styleNoTitle, Null, Null, Null, -1);
Plot(BBandTop( P, Period, Width ),"",colorLime,styleThick+styleNoTitle, Null, Null, Null, -1);
Plot(MA(C,Period),"",colorLime,styleThick+styleNoTitle, Null, Null, Null, -1);

Title=Name();


Filter=TopCond AND MidCond AND BotCond;
AddColumn(V,"volume",1.0);

_SECTION_END();

_SECTION_BEGIN("Price");
SetChartOptions(0,chartShowArrows|chartShowDates);
_N(Title = StrFormat("{{NAME}} - {{INTERVAL}} {{DATE}} Open %g, Hi %g, Lo %g, Close %g (%.1f%%) {{VALUES}}", O, H, L, C, SelectedValue( ROC( C, 1 ) ) ));
Plot( C, "Close", ParamColor("Color", colorGold ), styleNoTitle | ParamStyle("Style") | GetPriceStyle() );
_SECTION_END();
4 comments
Leave Comment
Please login here to leave a comment.
good one.. try in 5 min or 20 minutes timeframe
Nice one
Great work!
Great indicator!!!!