Tomy Frenchy for Amibroker (AFL)
kuwait over 16 years ago Amibroker (AFL)
Prediction AR (Auto-regressive)
- With Least Square / Durbin-Levinson / Gaussian Elimination
- Autocorrelation function estimator biased and not biased
- Denoising by centered T3 moving average
- Detrending by derivation
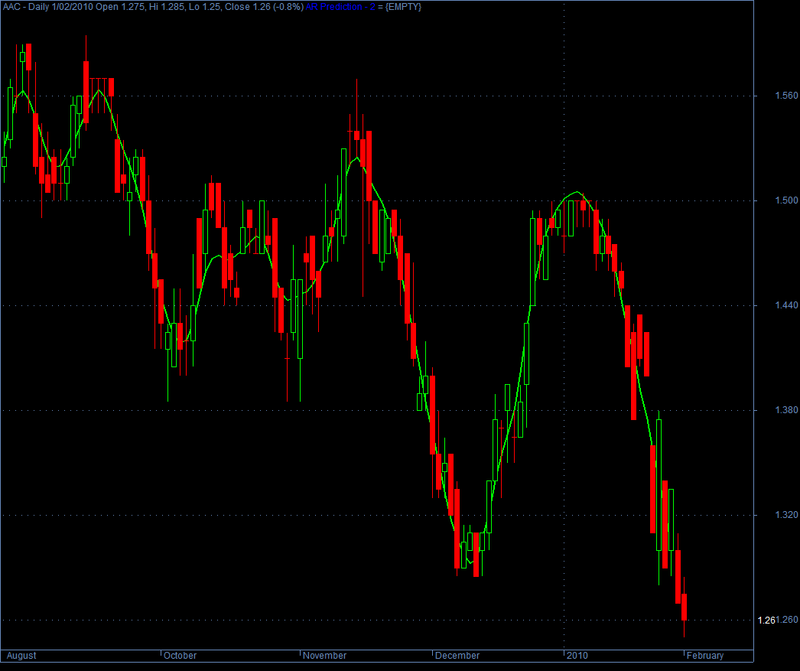
Screenshots
Indicator / Formula
Copy & Paste Friendly
_SECTION_BEGIN("tomy_frenchy");
//------------------------------------------------------------------------------
//
//  Author/Uploader: tomy_frenchy - tom_borgo [at] hotmail.com
//------------------------------------------------------------------------------
//
//  Prediction AR (Auto-regressive)
//
//  - With Least Square / Durbin-Levinson / Gaussian Elimination
//
//  - Autocorrelation function estimator biased and not biased
//
//  - Denoising by centered T3 moving average
//
//  - Detrending by derivation
//
//  TO DO:
//
//  - some problem of stability
//
//  - check optimum order for AR
//
//  - check correlation of residual to confirm the model
//
//  - PFE, Ramset, etc test for AR modeling efficiency
//
//  - maybe ARMA will be better ?
//
//------------------------------------------------------------------------------


// *********************************************************
// *
// * Prediction with model AR by Least Square / Autocorrelation
// * - Native AFL and VBS (for Gaussian Elimination if selected)
// * - biased or not biased estimator depending volatility
// * - averaging by T3 zerolag
// * - detrend by derivation
// *
// * - tomy_frenchy, v0.1
// * - fred for VBS Gaussian Elimination. Thanks a lot.
// *
// *********************************************************

// *********************************************************
// *
// *     Price field = Data to predict
// *     Periods = Periods for T3 filtering
// *     Slope = Slope for T3 filtering (0.7 to 0.83 for usual value)
// *     Methode = 0: Durbin-Levinson, 1: Gaussian Elimination
// *     Order  = Order of AR model
// *     ExtraF = Number of Bars to Extrapolate Forward
// *
// *********************************************************

// *********************************************************
// *
// *     Plotting :
// *     The bar position on the graphics separe in/out samples
// *     Green: computed from current data (centered T3 moving average)
// *     Blue: predicted, in-sample (AR, for the bar delayed because of T3 MA)
// *     Red: predicted, out-sample (AR, pure prediction)
// *
// *********************************************************


// For a resolution with Gaussian Elimination (more stable than Levinson-Durbin but slower)
EnableScript("VBScript");
<%
function Gaussian_Elimination (OrderAR, Autocorr)
    Dim b(200, 200)
    Dim w(200)
    Dim Coeff(200)

    for i = 1 To 200
        Coeff(i) = 0
    next

    n = OrderAR

    for i = 1 to n
        for j = 1 to  n
                b(i, j) = cDbl(Autocorr(abs(j - i)))
        next
        w(i) = cDbl(Autocorr(i))
    next

    n1 = n - 1
    for i = 1 to n1
        big = cDbl(abs(b(i, i)))
        q = i
        i1 = i + 1

        for j = i1 to n
            ab = cDbl(abs(b(j, i)))
            if (ab >= big) then
                big = ab
                q = j
            end if
        next

        if (big <> 0.0) then
            if (q <> i) then
                for j = 1 to n
                    Temp = cDbl(b(q, j))
                    b(q, j) = b(i, j)
                    b(i, j) = Temp
                next
                Temp = w(i)
                w(i) = w(q)
                w(q) = Temp
            end if
        end if

        for j = i1 to n
            t = cDbl(b(j, i) / b(i, i))
            for k = i1 to n
                b(j, k) = b(j, k) - t * b(i, k)
            next
            w(j) = w(j) - t * w(i)
        next
    next

    if (b(n, n) <> 0.0) then

        Coeff(n) = w(n) / b(n, n)
        i = n - 1

        while i > 0
            SumY = cDbl(0)
            i1 = i + 1
            for j = i1 to n
                SumY = SumY + b(i, j) * Coeff(j)
            next
            Coeff(i) = (w(i) - SumY) / b(i, i)
            i = i - 1
        wend

        Gaussian_Elimination = Coeff

    end if
end function
%>

function T3(price,periods,s) {
	e1=EMA(price,periods);
	e2=EMA(e1,Periods);
	e3=EMA(e2,Periods);
	e4=EMA(e3,Periods);
	e5=EMA(e4,Periods);
	e6=EMA(e5,Periods);
	c1=-s*s*s;
	c2=3*s*s+3*s*s*s;
	c3=-6*s*s-3*s-3*s*s*s;
	c4=1+3*s+s*s*s+3*s*s;
	Ti3=c1*e6+c2*e5+c3*e4+c4*e3;
	return ti3;
}

function f_centeredT3(data) {
	global slide;
	periods = Param("Periods", 5, 1, 200, 1);
	slope = Param("Slope", 0.7, 0, 3, 0.01);
	slide = floor(periods/2);
	centeredT3 = data;
	centeredT3 = Ref(T3(data,periods,slope),slide);
	centeredT3 = IIf( IsNan(centeredT3) OR !IsFinite(centeredT3) OR IsNull(centeredT3), data, centeredT3);
	return centeredT3;
}

function f_detrend(data) {
	detrended[0]=0;
	for (i = 1; i < BarCount; i++) detrended[i] = data[i] - data[i-1];
	return detrended;
}

function f_retrend(data, first_value, first_index, last_index) {
	for (i = 0; i < first_index; i++) retrended[i] = -1e10;
	retrended[first_index]=first_value;
	for (i = first_index + 1; i < last_index + 1; i++) retrended[i] = data[i] + retrended[i-1];
	for (i = last_index + 1; i < BarCount; i++) retrended[i] = -1e10;
	return retrended;
}

function AR(Data, BegBar, EndBar, OrderAR, ExtraF, Methode) {
BI = BarIndex();
Data_all = Data;
Data = IIf(BI < BegBar, 0, IIf(BI > EndBar, 0, Data));

LongBar = EndBar - BegBar + 1;


// Calcul for autocorrelation function
temp = MA(Data,LongBar);
moy_data = temp[EndBar];
data_centred = Data - moy_data;

for (i = 0; i < OrderAR + 1; i++) {
	temp = 0;
	for (j = BegBar; j < EndBar + 1 - i; j++) {
		temp = temp + data_centred[j]*data_centred[j+i];
	}
	//Autocorr[i]=(1/(LongBar))*temp; //biased estimator, small variance
	Autocorr[i]=(1/(LongBar-i))*temp; //not biased estimator, strong variance
}
Autocorr=Autocorr/Autocorr[0];


Gaussian_Elimination = Methode; // 0: Durbin-Levison, 1: Gaussian Elimination

if ( Gaussian_Elimination == 1 ) {
// Calcul AR parameters with Gaussian Elimination (vbs, more stable and precise, but slower)
VBS    = GetScriptObject();
AR_Coeff  = VBS.Gaussian_Elimination(OrderAR, Autocorr);
}

else {
// Calcul AR parameters with Durbin-Levison algorythm for Toeplitz matrix

// initialisation :
AR_Coeff = 0;
alpha[1] = Autocorr[0];
beta[1] = Autocorr[1];
k[1] = Autocorr[1] / Autocorr[0];
AR_Coeff[1] = k[1];

// itertive calcul :
for (n = 1; n < OrderAR; n++) {

// Last coefficient calcul
	// Step 1 : invert Coeff array
	for (i = 1; i < n + 1; i++) AR_Coeff_inv[n+1-i] =  AR_Coeff[i];

	// Step 2
	temp = 0;
	for (i = 1; i < n + 1; i++) temp = temp + Autocorr[i] * AR_Coeff_inv[i];
	beta[n+1] = Autocorr[n+1] - temp;

	// Step 3
	alpha[n+1] = alpha[n] * (1 - k[n]*k[n]);

	// Step 4
	k[n+1] = beta[n+1] / alpha[n+1];
	AR_Coeff[n+1] = k[n+1];

// Other older coefficients calcul
	// Step 5
	for (i = 1; i < n + 1; i++) New_AR_Coeff[i] = AR_Coeff[i] - k[n+1] * AR_Coeff_inv[i];

	// Step 6
	New_AR_Coeff[n+1] =  AR_Coeff[n+1];

// Update
	AR_Coeff = New_AR_Coeff;
}
}


// Prediction to +1 :
//Data = Data * Data_max;
AR_data = 0;
for (i = 1; i < OrderAR + 1; i++) {
	AR_data = AR_data + AR_Coeff[i] * Ref(Data,-i);
	printf("Coeff AR " + NumToStr(i, 1.0) + " = " + NumToStr(AR_Coeff[i], 1.9) + "\n");
}
AR_data = IIf(BI < BegBar, -1e10, IIf(BI > EndBar, -1e10, AR_data));


// Prédiction to +Forward
AR_data_pred = IIf(BI > EndBar, -1e10, Data); // to be sure not to compute future value
for (i = EndBar + 1; i < EndBar + 1 + ExtraF; i++) {
	temp = 0;
	for (j = 1; j < OrderAR + 1; j++) {
		temp = temp + AR_Coeff[j] * AR_data_pred[i-j];
	}
	AR_data_pred[i] = temp;
}
for (i = EndBar + 1; i < EndBar + 1 + ExtraF; i++) {
	AR_data[i] = AR_data_pred[i];
}


// End
return AR_data;
}


// *********************************************************
// *
// * Demo AFL to use AR Prediction
// *
// *********************************************************

SetBarsRequired(20000,20000);

BI = BarIndex();
current_pos = SelectedValue( BI ) - BI[ 0 ];
printf( "Position: " + WriteVal(current_pos) + "\n" );


// Denoising and detrending for stationnarity
data_source = ParamField("Price field",-1);
centeredT3 = f_centeredT3(data_source);
data = f_detrend(centeredT3);


// Choice of parameters
Methode = Param("Methode 0:DL, 1:GE",  0, 0, 1, 1);
longueur = Param("Longueur",  200, 1, 5000, 1);
OrderAR  = Param("nth Order AR", 2, 1, 50, 1);
ExtraF = Param("Extrapolate Forwards",  0, 0, 50, 1);


BegBar = current_pos - longueur - slide;
EndBar = current_pos - slide;


// Prediction calcul
AR_pred = AR(data, BegBar, EndBar, OrderAR, ExtraF, Methode);
AR_pred = f_retrend(AR_pred, centeredT3[EndBar], EndBar, EndBar + slide + ExtraF);


// Reconstruct data + prediction
Data_reconstruct = -1e10;
Data_reconstruct = IIf( BI <= EndBar AND BI >= BegBar, centeredT3, AR_pred);


// Plot result
Plot(Data_reconstruct, "AR Prediction - " + NumToStr(OrderAR, 1.0), IIf(BI > EndBar + slide, colorRed, IIf(BI > EndBar AND BI <= EndBar + slide, colorBlue, colorBrightGreen)), styleThick, Null, Null, 0);
_SECTION_END();
1 comments
Leave Comment
Please login here to leave a comment.
Gentlemen,
There is error in these lines :
for (i = 0; i < OrderAR + 1; i++) {
temp = 0;
for (j = BegBar; j < EndBar + 1 – i; j++) {
temp = temp + data_centred[j]*data_centred[j+i];
Error 10: Array subscript out of range. You must not access array elements outside 0. (BarCount-1) range. You attempted to access non-existing -3rd element of array.
I am not a coding guy, thought can do basic coding… but this is far beyond my current reach of knowledge, so any help would be greatly appreciated.
Warm Regards
FF