Stock Portfolio Organizer
The ultimate porfolio management solution.
Shares, Margin, CFD's, Futures and Forex
EOD and Realtime
Dividends and Trust Distributions
And Much More ....
WiseTrader Toolbox
#1 Selling Amibroker Plugin featuring:
Advanced Adaptive Indicators
Advanced Pattern Exploration
Neural Networks
And Much More ....
Nikhil for Amibroker (AFL)
Rating:
3 / 5 (Votes 4)
Tags:
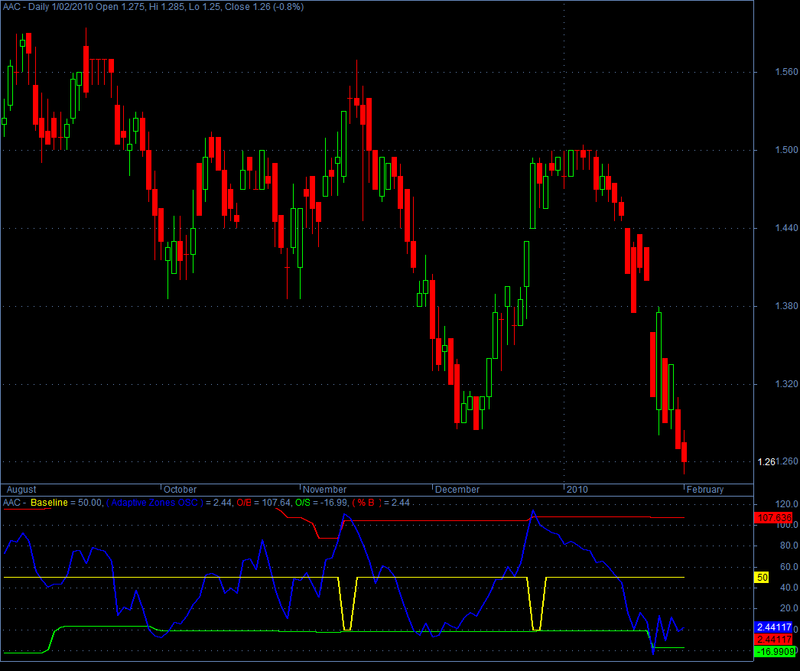
%B of Bollinger Bands With Adaptive Zones
Gives Percentage of where the close is in relation to the bands.
High reading ( Upper band ) , Low reading (Lower band )
Screenshots
Indicator / Formula
Copy & Paste Friendly
/* %B of Bollinger Bands With Adaptive Zones */
/* Gives Percentage of where the close is in relation to the bands.*/
/* High reading ( Upper band ) , Low reading (Lower band )
/* AFL code by Anthony Faragasso*/

//Inputs
Lookback=60;
Baseline=50;/*Do not Change*/
PerCent=95;
Pds =14;


b=( ( C+2 * StDev( C,20 ) - MA( C,20 ) ) / ( 4 * StDev( C,20 ) ) ) * 100;
/*Input */

Osc=b;

/*Value of Osc*/
Value1 = Osc;

/*Highest AND Lowest Values of Osc during Lookback Period*/
Value2 = HHV(Value1,Lookback);
Value3 = LLV(Value1,Lookback);

/*Range of Osc during Lookback Period*/
Value4 = Value2 - Value3;

/*Define PerCent of Range to determine OB AND OS levels*/
Value5 = Value4 * (PerCent / 100);

/*Calculate OB AND OS levels*/
Value6 = Value3 + Value5;
Value7 = Value2 - Value5;

baseline=IIf( Osc < 100 ,50 ,IIf( Osc < 0  ,0,0));

Plot(Baseline," Baseline",7,1+4); /* yellow*/
Plot(Value1,"( Adaptive Zones OSC )",6,1+4); /*BLUE*/
Plot(Value6,"O/B",4,1+4);  /*RED -TOP(SELL)*/
Plot(Value7,"O/S",5,1+4);  /*GREEN-BOT(BUY)*/

Plot(b,"( % B  )" ,4,1);
_SECTION_END();
0 comments
Leave Comment
Please login here to leave a comment.
Back