Stock Portfolio Organizer
The ultimate porfolio management solution.
Shares, Margin, CFD's, Futures and Forex
EOD and Realtime
Dividends and Trust Distributions
And Much More ....
WiseTrader Toolbox
#1 Selling Amibroker Plugin featuring:
Advanced Adaptive Indicators
Advanced Pattern Exploration
Neural Networks
And Much More ....
Market Profile for Amibroker (AFL)
Rating:
4 / 5 (Votes 2)
Tags:
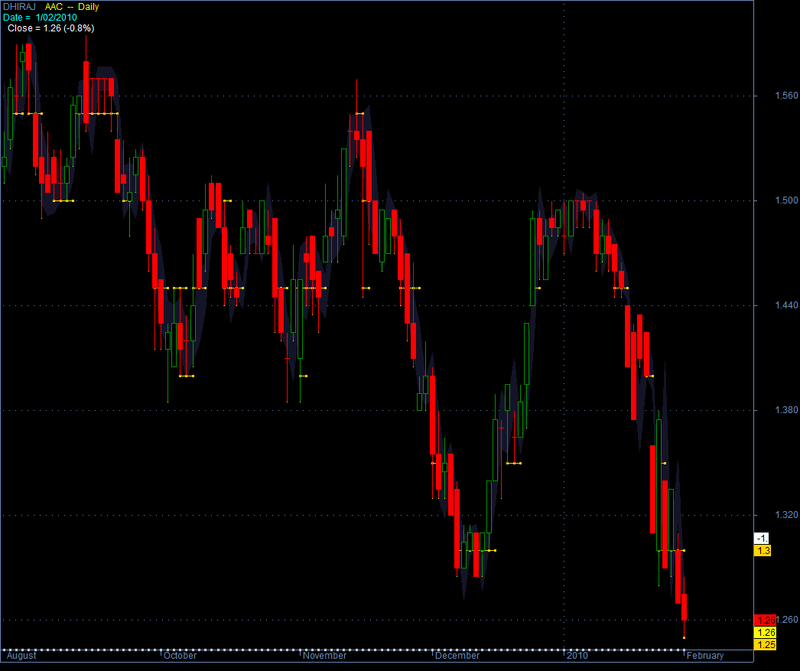
This Indicator is the famous Market Profile and work good Intraday 5 and 15 mins
Screenshots
Indicator / Formula
Copy & Paste Friendly
_SECTION_BEGIN("MarketProfile+OR+FPSR bold_POC+IB");
//------------------------------------------------------------------------------
//
//  Formula Name:    Market Profile
//
// Use with 5/15min chart
// Originial - From AFL lib
// Edited by - Milind

//Market Profile


Den = Param("Density", 1, 0.25, 100, 0.25); // Resolution in terms of $
IBBars = Param("Initial Balance Bars", 2, 0, 5, 1);
EnIB = Param("Show Initial Balance", 1, 0, 1, 1);
EnMP = Param("Show Market Profile", 1, 0, 2, 1);

PlotOHLC(O,H,L,C,"Price",IIf(C>O,colorGreen,colorRed),styleCandle);

BarsInDay = BarsSince(Day() != Ref(Day(), -1));
Bot = TimeFrameGetPrice("L", inDaily, 0);
Top = TimeFrameGetPrice("H", inDaily, 0);
Vol = TimeFrameGetPrice("V", inDaily, 0);
POC = H - H;
VAL = H - H;
VAH = H - H;
CurTop = HHV(H,BarsInDay+1);
Curbot = LLV(L,BarsInDay+1);
Range = Highest(Top-Bot);
TodayRange = Top - Bot;

AveRange = Sum(Top-Bot,30)/30;
LAveRange = AveRange[BarCount-1];
if (LAveRange < 1) {Den = 0.05;}
else if (LAveRange < 10) {Den = 0.25;}
else if (LAveRange < 20) {Den = 0.5;}
else if (LAveRange < 100) {Den = 1;}
else if (LAveRange < 500) {Den = 5;}
else {Den = 1;}

// Initialization
baseX = 0;
baseY = floor(Bot[0]/Den)*Den;
relTodayRange = 0;
firstVisBar = Status("firstvisiblebar");
lastVisBar = Status("lastvisiblebar");

D=.00025;

for (j=0; j <= 100; j++) {
  x[j] = 0;
}

i0 = 0;
i1 = 0;
for (i=0; i<BarCount; i++) {
  if (BarsInDay[i] == 0 AND i < firstVisBar) {
    i0 = i;
  }
  if (BarsInDay[i] == 0 AND i >= lastVisBar) {
    i1 = i;
  }
}

i1 = BarCount-1;
for (i=i0; i<=i1; i++) {
  if (BarsInDay[i] == 0) {
    baseX = i;
    baseY = floor(Bot[i]/Den)*Den;
    maxY = floor(Top[i]/Den)*Den;
    relTodayRange = (maxY-baseY)/Den;

    for (j=0; j <= relTodayRange; j++) {
      x[j] = 0;
    }
  }

  if (EnMP == 2) {
    for (j=0; j<= relTodayRange; j++) {
      if (L[i] <= baseY+j*Den AND H[i] >= baseY+j*Den) {
	PlotText(StrExtract("A,B,C,D,E,F,G,H,I,J,K,L,M,N",
                 BarsInDay[i]), baseX+x[j], baseY+j*Den, colorBlack);
        x[j]++;
      }
    }
  }
  else if (EnMP == 1) {
    for (j=0; j<= relTodayRange; j++) {
      if (L[i] <= baseY+j*Den AND H[i] >= baseY+j*Den) {
	line = LineArray(baseX, baseY+j*Den, baseX+x[j]+1, baseY+j*Den);
	Plot(line,"",ParamColor("Color", colorGold), styleLine+styleDots);
        x[j]++;
      }
    }
  }

  // Draw Initial Balance after 11am bar is complete
  if (BarsInDay[i] == IBBars+1 AND EnIB == 1) {
    Line1 = LineArray(i-2, curtop[i-1],i+10, curtop[i-1],0,True);
    Line1a=Line1+d*Line1;
    Line1b=Line1-d*Line1;
    Plot(Line1,"",colorBlue,styleDots+styleThick);
    Plot(Line1a,"",colorBlue,styleDots+styleThick|styleNoLabel);
    Plot(Line1b,"",colorBlue,styleDots+styleThick|styleNoLabel);


    Line1 = LineArray(i-2, curbot[i-1],i+10, curbot[i-1],0,True);
    Line1a=Line1+d*Line1;
    Line1b=Line1-d*Line1;
    Plot(Line1,"",colorBlue,styleDots+styleThick);
    Plot(Line1a,"",colorBlue,styleDots+styleThick|styleNoLabel);
    Plot(Line1b,"",colorBlue,styleDots+styleThick|styleNoLabel);
  }

  // Examine x[j]
  if ((i < BarCount - 1 AND BarsInDay[i+1] == 0) OR i == BarCount-1) {
    maxXj = 0;
    for (j=0; j<= relTodayRange; j++) {
      if (maxXj < x[j]) {maxXj = x[j]; maxj = j;}
    }
    for (k=i-BarsInDay[i];k<=i;k++) {
      POC[k] = baseY+maxXj*Den;
    }
    Line1 = LineArray(baseX, baseY+maxXj*Den, i, baseY+maxXj*Den,0,True);
    Line1a=Line1+d*Line1;
    Line1b=Line1-d*Line1;
    Plot(Line1,"",colorWhite,styleDots+styleThick);
    Plot(Line1a,"",colorWhite,styleDots+styleThick|styleNoLabel);
    Plot(Line1b,"",colorWhite,styleDots+styleThick|styleNoLabel);

  }
}

//Plot(POC,"POC",colorWhite,styleDots);
_SECTION_END();

_SECTION_BEGIN("Price");
SetChartOptions(0,chartShowArrows|chartShowDates);
_N(Title = StrFormat("{{NAME}} - {{INTERVAL}} {{DATE}}}", O, H, L, C, SelectedValue( ROC( C, 1 ) ) ));
Plot( C, "Close", ParamColor("Color", colorBlack ), styleNoTitle | styleHidden | ParamStyle("Style") | GetPriceStyle() );
_SECTION_END();

_SECTION_BEGIN("ORBO 10mt");
priceTitle=EncodeColor(colorYellow)+ StrFormat("    {{NAME}}  --  {{INTERVAL}}" ) + "\n"+ EncodeColor(colorCustom11)+
"Date =  " + Date() ;
ToolTip=StrFormat("  Close = %g (%.1f%%)",C,SelectedValue( ROC( C, 1 ) ));
Title ="DHIRAJ" + priceTitle + "\n" + EncodeColor(colorWhite) + ToolTip;


breakoutime = 100500;
afterbreakout0 = Cross(TimeNum(),100500);
afterbreakout1 = TimeNum()>=100500;
NewDay = Day()!= Ref(Day(), -1);
highestoftheday = HighestSince(newday,H,1);
Lowestoftheday =LowestSince(newday,L,1);
ORBHigh = ValueWhen(afterbreakout0,highestoftheday,1);
ORBLow = ValueWhen(afterbreakout0,lowestoftheday,1);
buycandidate =Cross(C,orblow) AND afterbreakout1;
sellcandidate = Cross(orbhigh,C) AND afterbreakout1 ;

BuyCond2 = Cross(C, WMA((L+C+H)/3,9)+0.01);/*((MidMA, LongMA);*/
SellCond4=Cross( WMA((L+C+H)/3,9)+0.01,C);
Buy1 = BuyCond2;
Sell1 = SellCond4 ;
entryprice=WMA((L+C+H)/3,9)+0.01;
ENTRYSELL=WMA((L+C+H)/3,9)-0.01;

Buy= Cross(C,orbhigh) AND afterbreakout1;
Sell = Cross(orblow,C) AND afterbreakout1;
color = IIf(Buy,colorGreen,IIf(Sell,colorRed,IIf(buycandidate,colorBlue,IIf(sellcandidate,colorPink,0))));


Plot(C,"",colorYellow,styleBar);
PlotShapes( shapeUpArrow * Buy, colorGreen,0,L,-12);
PlotShapes( shapeDownArrow * Sell, colorRed,0,H,-12);
//Plot(afterbreakout0,"",colorBlue,styleHistogram|styleOwnScale);

StyleOR=styleNoLine|styleDots+styleThick;

Plot(ORBHigh,"RESISTENCE",colorGreen,StyleOR);
Plot(ORBLow,"SUPPORT",colorRed,StyleOR);
Filter = Buy OR Sell OR sellcandidate  OR buycandidate OR Buy1 OR Sell1;


//Filter = Buy OR Sell OR sellcandidate  OR buycandidate;
AddColumn(C,"CMP",0,colorBlue);
AddColumn(IIf(Buy OR sellcandidate,ORBHigh,ORBLow),"INTRA ",0,colorDefault,color);
AddColumn(IIf(Buy1,entryprice,ENTRYSELL),"DELIVERY ",0,colorDefault,IIf(Buy1,colorGreen, colorRed));
_SECTION_END();


_SECTION_BEGIN("FPSR");

// Get Previous Day's close, Low and High
Prev_Close = TimeFrameGetPrice( "C", inDaily, -1, expandFirst) ;
Prev_Low = TimeFrameGetPrice( "L", inDaily, -1, expandFirst) ;
Prev_High = TimeFrameGetPrice( "H", inDaily, -1, expandFirst) ;
Today = LastValue(Day( ) );


//////////////////////////////30 MT STRATEGY /////////////////////////////////////////////////////////////
BS=(Prev_High-Prev_Low)/3;


Y=R30=Prev_Close+BS;
X=S30=Prev_Close-BS;
BSColor = ColorRGB(20,20,40);

PlotOHLC( 0, R30 , S30 ,S30 , "30MT", BSColor, styleCloud|styleNoLabel);
_SECTION_END();
0 comments
Leave Comment
Please login here to leave a comment.
Back