CZI Sidewinder LSMA Ribbon for Amibroker (AFL)
niladri over 14 years ago Amibroker (AFL)
I have seen many AFL’s where these bottom ribbons are seen, but lack of documentation always prevented me to concentrate on this area.
Here is an AFL ( ripped from Woodies CCI Panel ) to show CZI, Sidewinder & LSMA from bottom up order to assist in your trading.
Hope folks will like it!!
Theory::
From Woodies Book – The Revolutionary Way of Trading the CCI ( Page 18/19 )
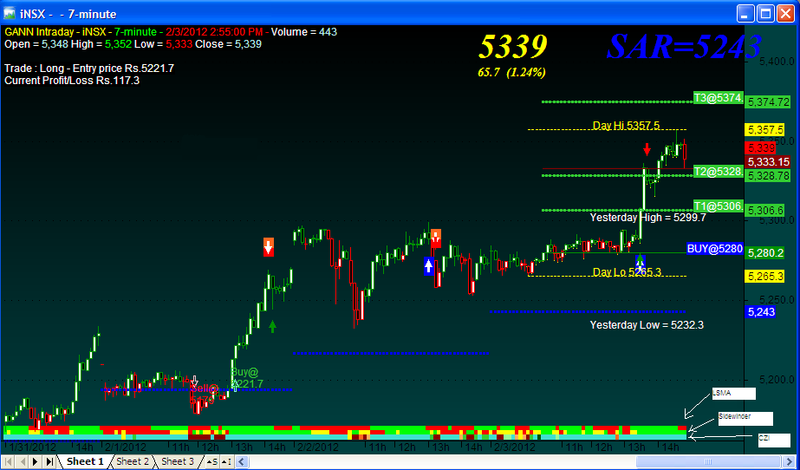
Sidewinder uses three colors – Red, Yellow AND Green. The Red color indicates no trend strength, while the Yellow color shows a trend developing and the Green color shows a strong trend. The Sidewinder shows trend strength both up and down. It helps traders in sideways market condition as a filtering tool just by one visual look at the bottom of the chart.
The Chop Zone Indicator (CZI) is also color coded. The key colors for CZI are Cyan (turquoise) and Brown. Cyan showing for three bars or more indicates an up market and Brown showing for three bars or more indicates a down market. Multiple colors indicate a sideways market or consolidating market. The three-bar rule is important.
LSMA is also known as the “linear regression curve”.
LSMA is used to confirm trade patterns and exiting positions.
Screenshots
Indicator / Formula
_SECTION_BEGIN("CHOP Zone Sidewinder LSMA");

/*
Sidewinder uses three colors - Red, Yellow AND Green.
The Red color indicates no trend strength, while the Yellow color shows a trend developing and the Green color shows a strong trend.
The Sidewinder shows trend strength both up and down.
It helps traders in sideways market condition as a filting tool just by one visual look at the bottom of the chart.

The Chop Zone Indicator (CZI) is also color coded.
The key colors for CZI are Cyan (turquoise) and Brown.
Cyan showing for three bars or more indicates an up market and Brown showing for three bars or more indicates a down market.
Multiple colors indicate a sideways market or consolidating market. The three-bar rule is important.

LSMA is also known as the "linear regression curve".
LSMA is used to confirm trade patterns and exiting positions.
*/

// Angle variables

PI = atan(1.00) * 4;
periods = 30;
HighHigh = HHV(H, periods);
LowLow = LLV(L, periods);
range = 25 / (HighHigh - LowLow) * LowLow;

// EMA34 Angle

EMA34 = EMA(C,34);
x1_EMA34 = 0;
x2_EMA34 = 1;
y1_EMA34 = 0;
y2_EMA34 = (Ref(EMA34, -1) - EMA34) / Avg * range;
c_EMA34 = sqrt((x2_EMA34 - x1_EMA34)*(x2_EMA34 - x1_EMA34) + (y2_EMA34 -
y1_EMA34)*(y2_EMA34 - y1_EMA34));
angle_EMA34 = round(180 * acos((x2_EMA34 - x1_EMA34)/c_EMA34) / PI);
angle_EMA34 = IIf(y2_EMA34 > 0, - angle_EMA34, angle_EMA34);

// LSMA25 Angle

LSMA25 = LinearReg(C, 25 );
x1_LSMA25 = 0;
x2_LSMA25 = 1;
y1_LSMA25 = 0;
y2_LSMA25 = (Ref(LSMA25, -1) - LSMA25) / Avg * range;
c_LSMA25 = sqrt((x2_LSMA25 - x1_LSMA25)*(x2_LSMA25 - x1_LSMA25) + (y2_LSMA25 - y1_LSMA25)*(y2_LSMA25 - y1_LSMA25));
angle_LSMA25 = round(180 * acos((x2_LSMA25 - x1_LSMA25)/c_LSMA25) / PI);
angle_LSMA25 = IIf(y2_LSMA25 > 0, - angle_LSMA25, angle_LSMA25);

// Color the bars for Woodies Trend Following

function Consecutive( array )
{
return BarsSince( NOT( array ) );
}
function Occurrences( array , period )
{
return Sum( array, period );
}

// CCI periods

zperiod=Param("CCI period",14,0,100);
z = CCI(zperiod);
array = z;

HighBars = Consecutive( array > 0 );
LowBars = Consecutive( array < 0 );

UpCondition = BarsSince( HighBars >= 6 AND Occurrences( array > 100 , 5 ) > 0 );
DnCondition = BarsSince( LowBars >= 6 AND Occurrences( array < -100 , 5 ) > 0 );
UpTrend = ( array > 0 ) AND ( UpCondition < DnCondition );
DnTrend = ( array < 0 ) AND ( UpCondition > DnCondition );
TrTrend = ( HighBars >= 5 AND NOT UpTrend ) OR ( LowBars >= 5 AND NOT DnTrend );
Color = IIf( UpTrend, colorBlue, IIf( DnTrend, colorRed, IIf( TrTrend, colorYellow, colorGrey40 ) ) );

// CHOP Zone Indicator

ColorANGLE_EMA = IIf(angle_EMA34 >=5,colorTurquoise,IIf(angle_EMA34 <5 AND angle_EMA34 >=3.57,colorDarkGreen,IIf(angle_EMA34 <3.57 AND angle_EMA34 >=2.14,colorPaleGreen,
IIf(angle_EMA34 <2.14 AND angle_EMA34 >=.71,colorLime,IIf(angle_EMA34 <=-1*5,colorDarkRed,IIf(angle_EMA34 >-1*5 AND angle_EMA34 <=-1*3.57,colorRed,
IIf(angle_EMA34 >-1*3.57 AND angle_EMA34 <=-1*2.14,colorOrange,IIf(angle_EMA34 >-1*2.14 AND angle_EMA34 <=-1*.71,colorLightOrange,colorYellow))))))));

//Plot(100,"", ColorANGLE_EMA , styleLine | styleThick | styleArea|styleNoLabel);
Plot( 1, /* defines the height of the ribbon in percent of pane width */"ribbon", ColorANGLE_EMA, /* choose color */ styleOwnScale|styleArea|styleNoLabel, -0.5, 100 );

// Sidewinder

SW = IIf((abs(angle_EMA34) >= 15) AND (abs(angle_EMA34 + angle_LSMA25) >= 50),IIf(angle_LSMA25 > 0, 2, -2),IIf((abs(angle_EMA34) >= 0) AND (((angle_EMA34 >= 0) AND (angle_LSMA25 >= 0))
OR ((angle_EMA34 <= 0) AND (angle_LSMA25 <= 0))) AND (abs(angle_EMA34 + angle_LSMA25) >= 5), IIf(angle_LSMA25 > 0, 1, -1), 0));
ColorSW = IIf(abs(SW) == 2, colorBrightGreen, IIf(abs(SW) == 1, colorYellow, colorRed));
Plot( 2, /* defines the height of the ribbon in percent of pane width */"ribbon", ColorSW, /* choose color */ styleOwnScale|styleArea|styleNoLabel, -0.5, 100 );


// LSMA
ColorLSMA =  IIf(C > LSMA25,colorBrightGreen,IIf(C < LSMA25,colorRed,colorTeal));
Plot( 3, /* defines the height of the ribbon in percent of pane width */"ribbon", ColorLSMA, /* choose color */ styleOwnScale|styleArea|styleNoLabel, -0.5, 100 );

_SECTION_END();
5 comments
Leave Comment
Please login here to leave a comment.
AFL NOT WORKING
This is not a standalone AFL…it needs to be overlayed on top of a open chart to get the bottom ribbons only.
Do not expect to see other goodies as shown on the image.
dear friend please post whole formula which the page shows e.i sar with sidwinder
From the above AFL…one may drop the following section ( I found this is not reqd for plotting CZI/Sidewinder/LSMA ribbon’s at the bottom of the chart )
==============
As per the above req…I have uploaded the modified SAR indicator in the link below:
http://www.wisestocktrader.com/indicators/2704-sar-stop-reverse
This will plot SAR lines for each day & gives a better visual ref, toggle is prvided to disble only the lines as well, if not reqd to clear chart area.
Niladri
Plz post the Complete afl mentioned in picture