True Price Action Indicator for Amibroker (AFL)
niladri over 14 years ago Amibroker (AFL)
Theory: http://www.trading-naked.com/Buffy_Price_Action.htm
I suggest everyone to read & understand the above content, it is the best source on the topic.
This indicator will plot HH LL HL LH levels on the chart ( as mentioned in the above theory ).
I have provided a toggle for this indicator & “% Change” variable.
To plot these labels on lower TF chart…just drag the slider value around 0.3/0.4.
Hope this helps!
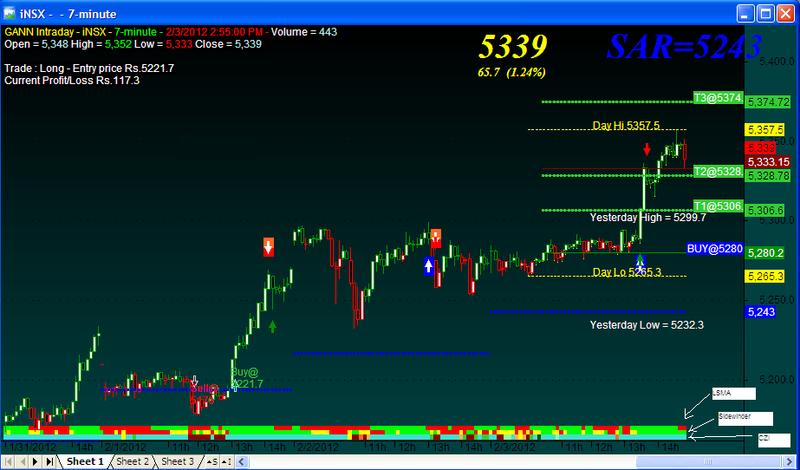
Screenshots
Indicator / Formula
Copy & Paste Friendly
_SECTION_BEGIN("Price Action");

pa = ParamToggle("Price Action","Show|Hide",0);
Q = Param( "% Change", 1, 0, 5, 0.1 );
if (pa == 1 ){


	Z = Zig( C , q ) ;

	HH = ( ( Z < Ref( Z, -1 ) AND Ref( Z, -1 ) > Ref( Z, -2 ) ) AND (Peak( z, q, 1 ) > Peak( Z, q, 2 ) ) );
	LH = ( ( Z < Ref( Z, -1 ) AND Ref( Z, -1 ) > Ref( Z, -2 ) ) AND (Peak( Z, q, 1 ) < Peak( Z, q, 2 ) ) );
	HL = ( ( Z > Ref( Z, -1 ) AND Ref( Z, -1 ) < Ref( Z, -2 ) ) AND (Trough( Z, q, 1 ) > Trough( Z, q, 2 ) ) );
	LL = ( ( Z > Ref( Z, -1 ) AND Ref( Z, -1 ) < Ref( Z, -2 ) ) AND (Trough( Z, q, 1 ) < Trough( Z, q, 2 ) ) );

	dist = 0.5 * ATR( 20 );

	for ( i = 0; i < BarCount; i++ )
	{
   		if ( HH[i] )	      PlotText( "HH", i, H[ i ] + dist[i], colorYellow );
    	if ( LH[i] )        PlotText( "LH", i, H[ i ] + dist[i], colorYellow );
    	if ( HL[i] )        PlotText( "HL", i, L[ i ] - dist[i], colorPink );
    	if ( LL[i] )        PlotText( "LL", i, L[ i ] - dist[i], colorPink );

	}
}
_SECTION_END();
3 comments
Leave Comment
Please login here to leave a comment.
The attached image is not correct…pls check http://www.wisestocktrader.com/indicators/2704-sar-stop-reverse for the correct image.
very good
itsnot work