Stock Portfolio Organizer
The ultimate porfolio management solution.
WiseTrader Toolbox
#1 Selling Amibroker Plugin featuring:
THISH Measurer for Amibroker (AFL)
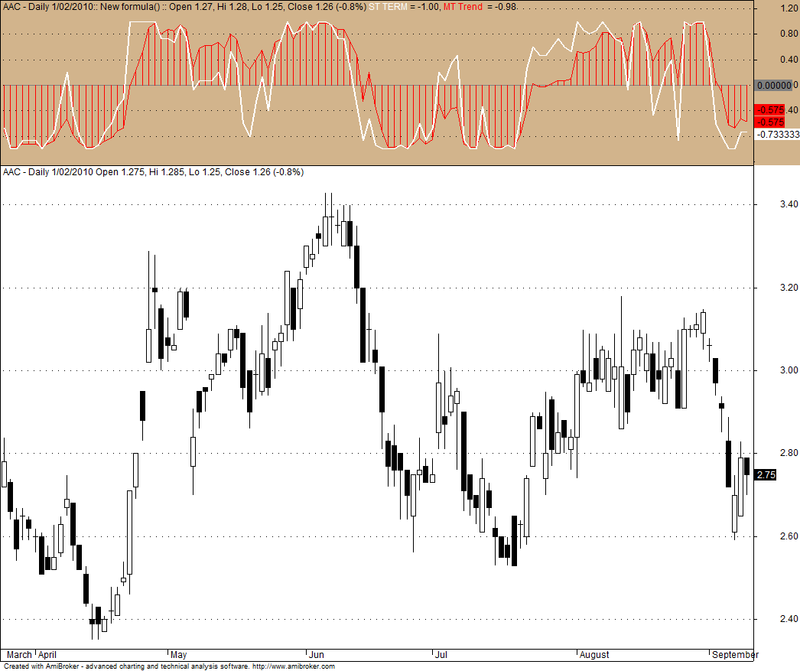
Suggestion For Confirming Your Trading Signals With Your Tush
When the red MT histo is above zero the MT trend is positive, and vice versa,
When the black ST line is above zero the ST trend is positive, and vice versa.
Long Setup confirmation – for pullback trades.
The red MT histo is above zero, the higher the better = the stronger the trend.
The black ST line drops below zero. We are now in the ZONE – the long setup zone.
Look for the ST line to commence a retracement towards/above the zero line
which would signal a probable/possible recommencement of the uptrend.
Short Setup confirmation – for pullback trades.
Vice Versa.
Screenshots
Indicator / Formula
/*
Suggestion For Confirming Your Trading Signals With Your Tush

When the red MT histo is above zero the MT trend is positive, and vice versa,
When the black ST line is above zero the ST trend is positive, and vice versa.

Long Setup confirmation - for pullback trades.
The red MT histo is above zero, the higher the better = the stronger the trend.
The black ST line drops below zero. We are now in the ZONE - the long setup zone.
Look for the ST line to commence a retracement towards/above the zero line
which would signal a probable/possible recommencement of the uptrend.

Short Setup confirmation - for pullback trades.
Vice Versa.
*/

SetChartBkColor( ParamColor( "bk color",colorTan ) );
// Bullish Measurements
B1=IIf(C>=Ref(C,-1),1,0);   B2=IIf(C>=Ref(C,-2),1,0);   B3=IIf(C>=Ref(C,-3),1,0);
B4=IIf(C>=Ref(C,-4),1,0);   B5=IIf(C>=Ref(C,-5),1,0);   B6=IIf(C>=Ref(C,-6),1,0);
B7=IIf(C>=Ref(C,-7),1,0);   B8=IIf(C>=Ref(C,-8),1,0);   B9=IIf(C>=Ref(C,-9),1,0);
B10=IIf(C>=Ref(C,-10),1,0); B11=IIf(C>=Ref(C,-11),1,0); B12=IIf(C>=Ref(C,-12),1,0);
B13=IIf(C>=Ref(C,-13),1,0); B14=IIf(C>=Ref(C,-14),1,0); B15=IIf(C>=Ref(C,-15),1,0);
B16=IIf(C>=Ref(C,-16),1,0); B17=IIf(C>=Ref(C,-17),1,0); B18=IIf(C>=Ref(C,-18),1,0);
B19=IIf(C>=Ref(C,-19),1,0); B20=IIf(C>=Ref(C,-20),1,0); B21=IIf(C>=Ref(C,-21),1,0);
B22=IIf(C>=Ref(C,-22),1,0); B23=IIf(C>=Ref(C,-23),1,0); B24=IIf(C>=Ref(C,-24),1,0);
B25=IIf(C>=Ref(C,-25),1,0); B26=IIf(C>=Ref(C,-26),1,0); B27=IIf(C>=Ref(C,-27),1,0);
B28=IIf(C>=Ref(C,-28),1,0); B29=IIf(C>=Ref(C,-29),1,0); B30=IIf(C>=Ref(C,-30),1,0);
B31=IIf(C>=Ref(C,-31),1,0); B32=IIf(C>=Ref(C,-32),1,0); B33=IIf(C>=Ref(C,-33),1,0);
B34=IIf(C>=Ref(C,-34),1,0); B35=IIf(C>=Ref(C,-35),1,0); B36=IIf(C>=Ref(C,-36),1,0);
B37=IIf(C>=Ref(C,-37),1,0); B38=IIf(C>=Ref(C,-38),1,0); B39=IIf(C>=Ref(C,-39),1,0);
B40=IIf(C>=Ref(C,-40),1,0);
// Bearish Measurements
C1=IIf(C<=Ref(C,-1),1,0);   C2=IIf(C<=Ref(C,-2),1,0);   C3=IIf(C<=Ref(C,-3),1,0);
C4=IIf(C<=Ref(C,-4),1,0);   C5=IIf(C<=Ref(C,-5),1,0);   C6=IIf(C<=Ref(C,-6),1,0);
C7=IIf(C<=Ref(C,-7),1,0);   C8=IIf(C<=Ref(C,-8),1,0);   C9=IIf(C<=Ref(C,-9),1,0);
C10=IIf(C<=Ref(C,-10),1,0);  C11=IIf(C<=Ref(C,-11),1,0); C12=IIf(C<=Ref(C,-12),1,0);
C13=IIf(C<=Ref(C,-13),1,0); C14=IIf(C<=Ref(C,-14),1,0); C15=IIf(C<=Ref(C,-15),1,0);
C16=IIf(C<=Ref(C,-16),1,0); C17=IIf(C<=Ref(C,-17),1,0); C18=IIf(C<=Ref(C,-18),1,0);
C19=IIf(C<=Ref(C,-19),1,0); C20=IIf(C<=Ref(C,-20),1,0); C21=IIf(C<=Ref(C,-21),1,0);
C22=IIf(C<=Ref(C,-22),1,0); C23=IIf(C<=Ref(C,-23),1,0); C24=IIf(C<=Ref(C,-24),1,0);
C25=IIf(C<=Ref(C,-25),1,0); C26=IIf(C<=Ref(C,-26),1,0); C27=IIf(C<=Ref(C,-27),1,0);
C28=IIf(C<=Ref(C,-28),1,0); C29=IIf(C<=Ref(C,-29),1,0); C30=IIf(C<=Ref(C,-30),1,0);
C31=IIf(C<=Ref(C,-31),1,0); C32=IIf(C<=Ref(C,-32),1,0); C33=IIf(C<=Ref(C,-33),1,0);
C34=IIf(C<=Ref(C,-34),1,0); C35=IIf(C<=Ref(C,-35),1,0); C36=IIf(C<=Ref(C,-36),1,0);
C37=IIf(C<=Ref(C,-37),1,0); C38=IIf(C<=Ref(C,-38),1,0); C39=IIf(C<=Ref(C,-39),1,0);
C40=IIf(C<=Ref(C,-40),1,0);

// Combining the daily Bullish ingredients of the Short-term trend
ConditionA= (B1+B2+B3+B4+B5+B6+B7+B8+
            B9+B10+B11+B12+B13+B14+B15)/15 ;
// Combining the daily Bearish ingredients of the Short-term trend
ConditionB= (C1+C2+C3+C4+C5+C6+C7+C8+
            C9+C10+C11+C12+C13+C14+C15)/15 ;
// Combining the daily Bullish ingredients of the Medium-term trend
ConditionC= (B1+B2+B3+B4+B5+B6+B7+B8+B9+B10+B11+B12+B13+B14+B15+
            B16+B17+B18+B19+B20+B21+B22+B23+B24+B25+B26+B27+B28+
            B29+B30+B32+B33+B34+B35+B36+B37+B38+B39+B40)/40 ;
// Combining the daily Bearish ingredients of the Medium-term trend
ConditionD= (C1+C2+C3+C4+C5+C6+C7+C8+C9+C10+C11+C12+C13+C14+C15+
            C16+C17+C18+C19+C20+C21+C22+C23+C24+C25+C26+C27+C28+
            C29+C30+C32+C33+C34+C35+C36+C37+C38+C39+C40)/40 ;

Plot(ConditionA-ConditionB,"ST TERM",2,4);
Plot(ConditionC-ConditionD,"MT Trend ",4,1);
Plot(ConditionC-ConditionD,"",4,2);

Plot(0,"",colorGrey50);
GraphXSpace= 10;
_SECTION_BEGIN("");
_N(Title = "{{NAME}} - {{INTERVAL}} {{DATE}}:: "+_DEFAULT_NAME()+" :: {{OHLCX}} {{VALUES}}"
+"\n"+EncodeColor(colorYellow));
0 comments
Leave Comment
Please login here to leave a comment.
Back