Stock Portfolio Organizer
The ultimate porfolio management solution.
WiseTrader Toolbox
#1 Selling Amibroker Plugin featuring:
4MACD for Amibroker (AFL)
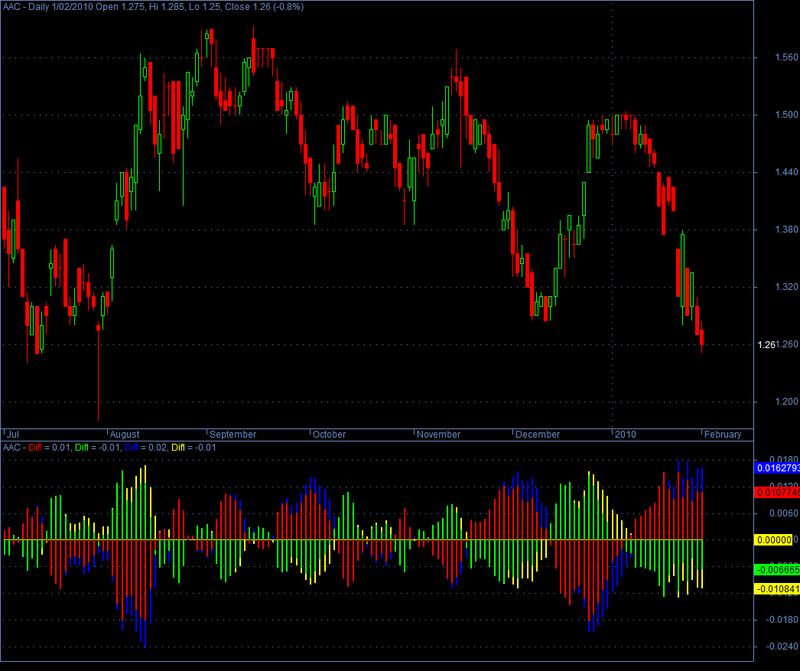
4MACD – The code was first developed in TC2000 and consists of four overlaid MACD histograms, made to display with different colors. This produces a “visual” signal and actions are taken based on the color combinations.
For example:
When red is on top and green on the bottom – you want to be short or in cash.
There are two additional colors that help one determine when to enter and when to exit.
When green is on top and one notices that the tips of the green histogram are turning yellow and the red histograms on the bottom are getting blue tips – go to cash now or short now.
When red is at the top and starts to form blue tips or yellow tips are forming on the green while green is in the bottom of the chart – one wants to go long with the fund or stock.
Other indicators should be used.
Orig coding by Robert Cummings
Screenshots
Indicator / Formula
//  4MACD.afl

//=Red===================
Gr1 = MACD(17,7);
Gr2 = Signal(17,7,5);
Diffr = Gr1-Gr2;
Plot((LastValue(Highest(diffr))/LastValue(Highest(diffr)))
*Diffr,"Diff",colorRed,2+4);

//=Green===================
Gr1 = MACD(5,13);
Gr2 = Signal(5,13,5);
Diffg = Gr1-Gr2;
Plot((LastValue(Highest(diffr))/LastValue(Highest(diffg)))
*Diffg,"Diff",colorBrightGreen,2+4);

//=Blue===================
Gr1 = MACD(17,14);
Gr2 = Signal(17,14,5);
Diffb = Gr1-Gr2;
Plot((LastValue(Highest(diffr))/LastValue(Highest(diffb)))
*Diffb,"Diff",colorBlue,2+4);

//=Yellow===================
Gr1 = MACD(12,18);
Gr2 = Signal(12,18,4);
Diffy = Gr1-Gr2;
Plot((LastValue(Highest(diffr))/LastValue(Highest(diffy)))
*Diffy,"Diff",colorYellow,2+4);

Plot(0,"",7,4);
GraphXSpace=5;

// END CODE
0 comments
Leave Comment
Please login here to leave a comment.
Back