Add automatic lines to pricechart for Amibroker (AFL)
Dryden over 14 years ago Amibroker (AFL)
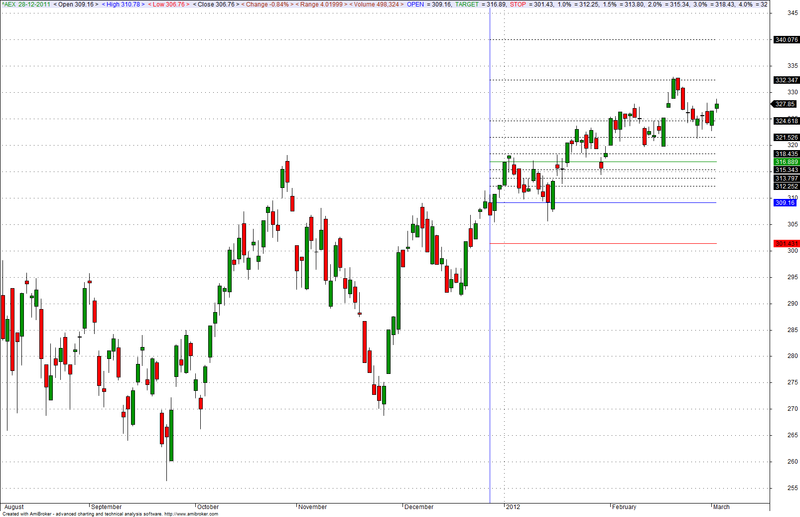
adds automatic lines to the price chart, based on the bar you select with the mouse.
currently, profittarget is 2.5% green line; stoploss is 2.5 red line
blue line, is the open
dottedlines are the levels to quickly see the potential of a trade.
in paramters you can select either long or short
Screenshots
Indicator / Formula
Copy & Paste Friendly
_SECTION_BEGIN("__add automatic lines to pricechart");

STOPLOSS = 2.5;
PROFIT = 2.5;
EPT1= 1.0;
EPT1a=1.5;
EPT2= 2.0;
EPT3= 3.0;
EPT4= 4.0;

EPT5= 5.0;
EPT6= 7.5;
EPT7= 10.0;

mystartbar = SelectedValue(BarIndex()); // FOR GRAPHING
mystartbardate = LastValue(ValueWhen(mystartbar == BarIndex(),DateNum(),1));

InitialValue = LastValue(ValueWhen(mystartbardate == DateNum(), O , 1 ) ) ;
Temp1 = IIf(BarIndex() >= mystartbar, InitialValue, Null) ;

LinesLONG  = ParamToggle("Toon lijnen positie LONG ","No|Yes",0);
LinesSHORT = ParamToggle("Toon lijnen positie SHORT ","No|Yes",1);

if (LinesLONG  )
Plot(Temp1, " OPEN ", colorBlue,styleLine) AND
Plot((1+(LastValue(PROFIT)/100))*(Temp1), " TARGET ", colorGreen, styleLine | styleThick ) AND
Plot((1-(LastValue(STOPLOSS)/100))*(Temp1), " STOP ", colorRed, styleLine | styleThick ) AND
Plot((1+(LastValue(EPT1)/100))*(Temp1), " 1.0% ", colorBlack, styleLine|styleDashed) AND
Plot((1+(LastValue(EPT1a)/100))*(Temp1), " 1.5% ", colorBlack, styleLine|styleDashed) AND
Plot((1+(LastValue(EPT2)/100))*(Temp1), " 2.0% ", colorBlack, styleLine|styleDashed) AND
Plot((1+(LastValue(EPT3)/100))*(Temp1), " 3.0% ", colorBlack, styleLine|styleDashed) AND
Plot((1+(LastValue(EPT4)/100))*(Temp1), " 4.0% ", colorBlack, styleLine|styleDashed) AND

Plot((1+(LastValue(EPT5)/100))*(Temp1), " 5.0% ", colorBlack, styleLine|styleDashed) AND
Plot((1+(LastValue(EPT6)/100))*(Temp1), " 7.5% ", colorBlack, styleLine|styleDashed) AND
Plot((1+(LastValue(EPT7)/100))*(Temp1), " 10.0% ", colorBlack, styleLine|styleDashed);

if (LinesSHORT )
Plot(Temp1, " OPEN ", colorBlue,styleLine) AND
Plot((1-(LastValue(PROFIT)/100))*(Temp1), " TARGET ", colorGreen, styleLine | styleThick ) AND
Plot((1+(LastValue(STOPLOSS)/100))*(Temp1), " STOP ", colorRed, styleLine | styleThick ) AND
Plot((1-(LastValue(EPT1)/100))*(Temp1), " 1.0% ", colorBlack, styleLine|styleDashed) AND
Plot((1-(LastValue(EPT1a)/100))*(Temp1), " 1.5% ", colorBlack, styleLine|styleDashed) AND
Plot((1-(LastValue(EPT2)/100))*(Temp1), " 2.0% ", colorBlack, styleLine|styleDashed) AND
Plot((1-(LastValue(EPT3)/100))*(Temp1), " 3.0% ", colorBlack, styleLine|styleDashed) AND
Plot((1-(LastValue(EPT4)/100))*(Temp1), " 4.0% ", colorBlack, styleLine|styleDashed) AND

Plot((1-(LastValue(EPT5)/100))*(Temp1), " 5.0% ", colorBlack, styleLine|styleDashed) AND
Plot((1-(LastValue(EPT6)/100))*(Temp1), " 7.5% ", colorBlack, styleLine|styleDashed) AND
Plot((1-(LastValue(EPT7)/100))*(Temp1), " 10.0% ", colorBlack, styleLine|styleDashed) AND
_SECTION_END();
3 comments
Leave Comment
Please login here to leave a comment.
szgolyas, use latest amibroker version
drag this indicator over pricechart
Hi,
Can you please give this code in English
Would Highly Appreciate the same.
Thanks,
Sandip.