VWAP Bands v2 for Amibroker (AFL)
MagicTH over 14 years ago Amibroker (AFL)
I took code that was already posted and improved on it at the poster’s request because it was “too slow”.
I made the following changes:
Code is now 10+ times faster per request.
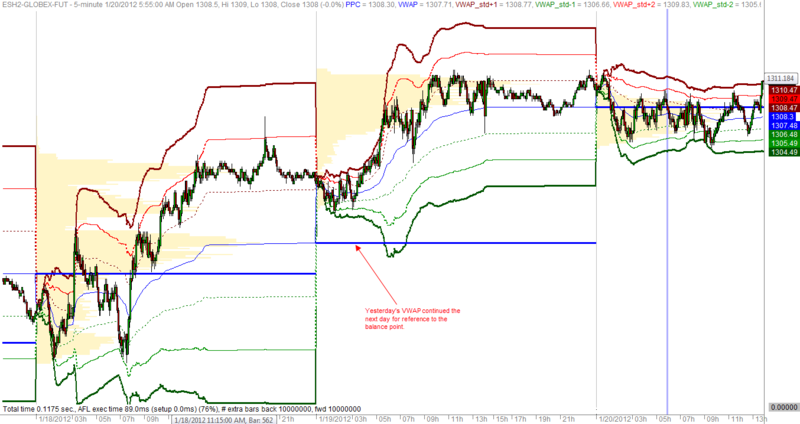
Added a 3rd band.
Added a static line show prior period’s VWAP centerline
Added Weekly and Monthly period choices. Default is Daily
Included Multi-VWAP display from AB 5.50 — just Delete Study if you don’t want this.
I also note that the VWAP bands provided by AB do not seem to match up exactly with the VWAP indicator as programmed. I do not know enough about the indicator to say for sure, but the “peak” volume from Tomasz VWAP plot does not match up with the ending value of VWAP in this indicator and I should. This is because I think that the VWAP is the same as the Market Profile POC (point of control), but I don’t know for sure.
PS: It’s got a few _TRACE() statements in it that you can delete. They are just for problem solving.
Screenshots
Indicator / Formula
// TerryH - afl@rivelle.com 3/9/2012
// Move AvgPrice computation before the loop so it's only done ONCE in an array.
// Replace SetBarsRequired with only computing visible bars...back to the start of the oldest time period even if it's "off screen".
// These 2 changes make it run in 1/12th the time. No doubt database dependent on how much time is saved.// VWAP code that also plots 3 standard deviations.
// I think more savings is possible, but will take a harder look to find.

// NOTE: the code is SLOOOOWWWW...can someone help speed it up?
// I tried my best, but can't really do much with the two for-loops...
//
// LarryJR - ljr500@hotmail.com

SetBarsRequired(-2,-2);
_TRACE( "!CLEAR!" );		//For trouble-shooting

//PlotOHLC( O, H, L, C, "Price", colorDefault, styleCandle );
_SECTION_BEGIN("Price");
    SetChartOptions(0,chartShowArrows|chartShowDates);
    _N(Title = StrFormat("{{NAME}} - {{INTERVAL}} {{DATE}} Open %g, Hi %g, Lo %g, Close %g (%.1f%%) {{VALUES}}", O, H, L, C, SelectedValue( ROC( C, 1 ) ) ));
    Plot( C, "Close", ParamColor("Color", colorBlack ), styleNoTitle | ParamStyle("Style") | GetPriceStyle() );
_SECTION_END();

//Just do this once as an array. Saves 40% the compute time from ~ 1 second to ~ .6 seconds
AvgPrice = ( O + H + L + C ) / 4;

// Store true/false based on a new calendar day...
// Added Weekly, Monthly breaks.
// Also for futures, need to add break at new trading Day, which is NOT midnight.

period = ParamList( "What period?", "Daily|Weekly|Monthly", 0 );

switch ( period )
{

case "Daily":
    newPeriod = Day() != Ref( Day(), -1 );
    break;

case "Weekly":
    newPeriod = DayOfWeek() == 0 AND Ref( DayOfWeek(), -1 ) != 0;
    break;

case "Monthly":
    newPeriod = Month() != Ref( Month(), -1 );
    break;
}

//--Setup-----------

bi = BarIndex();		// Just shorthand
StartBar = StrToNum("2");	//1st bar == 0. Set to 1 so Ref(xxx, -1) doesn't give an error
EndBar = BarCount -1;
ExtraBarsRequired = 0;

//CalcRangeAll = ParamToggle( "Calc ALL or VISIBLE?", "VISIBLE|ALL", 0 );		//Option to compute all bars in case of Backtesting or Explore if you add this kind of code.

if ( Status( "action" ) < 3 )		// Limit to visible range unless we're doing Backtest, Explore, Scan, Optimize.
    // In other words, for viewing/commentary we only compute what we can see.
    // Saves add'l 85% the compute time from ~ .6 second to ~ .09 seconds.
{
    //This code finds only the VISIBLE chart area, which may or may not be the most recent day. This let's me look at any day for evaulation purposes.
    FirstVisibleBar = FirstVisibleValue( bi );
    _TRACE( "1st Visible: " + FirstVisibleBar );
    LastVisibleBar = LastVisibleValue( bi );						//Testing shows this returns BarIndex (0 based) values. So, if you want to use in a loop the last value IS the last bar.
    VisibleBars = LastVisibleBar - FirstVisibleBar;			//Used in trouble-shooting.
    _TRACE( "1st Visible: " + FirstVisibleBar + "    Last Visible: " + LastVisibleBar + "    #bars: " + VisibleBars );

    StartBar = FirstVisibleBar;		//We get variable results when there are not 2 periods of data available so we won't show them at all.
    EndBar = LastVisibleBar;
    flag = StrToNum( "0" );				//Force a numeric value

    for ( k = FirstVisibleBar; k > 0; k-- )
    {
        if ( newPeriod[k] )
        {
            flag++;

            if ( flag == 2 ) 							//Need to lookback 2 periods if possible
            {
                StartBar = k;							//Set starting location
                k = 0;										//End the loop
            }
        }
    }

    if ( flag < 2 )												//We have less than 2 periods of history to the left, so we must start displaying no sooner than the 1st newPeriod that is on-screen
    {
        for ( k = 1; k < EndBar; k++ )
        {
            if ( newPeriod[k] )
            {
                StartBar = k;
                k = EndBar;
            }
        }
    }
}

_TRACE("1st Required: " + StartBar + "    Last Required: " + EndBar + "    Extra Bars: " + ExtraBarsRequired + "    Bar in Database: " + BarCount );

// Initialize loop variables
SumPriceVolume = 0;
totVolume = 0;
VWAP = 0;
stddev = 0;
newPeriodindex = EndBar;		//Move way out until we find a "real one"
Variance = 0;
//Initialize the plotted variables for early data we cannot compute without getting variable results.
VWAP = C[1];
stddev_1_pos = stddev_1_neg = stddev_2_pos = stddev_2_neg = stddev_3_pos = stddev_3_neg = C[1];

// we must use a loop here because we need to save the vwap for each bar to calc the variance later

for ( i = startBar; i <= EndBar; i++ )
{
    // only want to reset our values at the start of a new period
    if ( newPeriod[i] )
    {
        SumPriceVolume = 0;
        totVolume = 0;
        newPeriodindex = i;  // this is the index at the start of a new period
        Variance = 0;
    }

    // Sum of Volume*price for each bar
    sumPriceVolume += AvgPrice[i] * ( Volume[i] );

    // running total of volume each bar
    totVolume += ( Volume[i] );

    if ( totVolume[i] > 0 )
    {
        VWAP[i] = Sumpricevolume / totVolume ;
        VWAPtemp = VWAP[i];
    }

    // now the hard part...calculate the variance...
    // a separate calc from the start of each day - note it requires the vwap from above
    // also note, we calculate starting at the first bar in the new day to today to the curent bar
    Variance = 0;

    for ( j = newPeriodindex; j < i; j++ )
    {
        Variance += ( Volume[j] / totVolume ) * ( Avgprice[j] - VWAPtemp ) * ( Avgprice[j] - VWAPtemp );
    }

    sqrtVariance = sqrt( Variance );

    stddev_1_pos[i] = VWAPtemp + sqrtVariance;
    stddev_1_neg[i] = VWAPtemp - sqrtVariance;

    stddev_2_pos[i] = VWAPtemp + sqrtVariance * 2;
    stddev_2_neg[i] = VWAPtemp - sqrtVariance * 2;

    stddev_3_pos[i] = VWAPtemp + sqrtVariance * 3;
    stddev_3_neg[i] = VWAPtemp - sqrtVariance * 3;
}

//Prior period VWAP centerline
PPC = ValueWhen( newPeriod == True, Ref(VWAP, -1), 1);
Plot ( PPC, "PPC", colorBlue, styleDots|styleNoLine|styleNoRescale );
Plot ( VWAP, "VWAP", colorBlue, styleLine );
Plot ( stddev_1_pos, "VWAP_std+1", ColorRGB( 128, 0, 0 ), styleDashed );
Plot ( stddev_1_neg, "VWAP_std-1", ColorRGB( 0, 128, 0 ), styleDashed );
Plot ( stddev_2_pos, "VWAP_std+2", colorRed, styleDashed | styleThick );
Plot ( stddev_2_neg, "VWAP_std-2", colorGreen, styleDashed | styleThick );
Plot ( stddev_3_pos, "VWAP_std+3", colorDarkRed, styleDots | styleThick );
Plot ( stddev_3_neg, "VWAP_std-3", colorDarkGreen, styleDots | styleThick );

_SECTION_BEGIN("VAP");
segments = IIf( Interval() < inDaily, Day(), Month() );
segments = segments != Ref( segments , -1 );

PlotVAPOverlayA( segments , Param("Lines", 300, 100, 1000, 1 ), Param("Width", 80, 1, 100, 1 ), ParamColor("Color", ColorRGB(255,245,200) ), ParamToggle("Side", "Left|Right" ) | 2 * ParamToggle("Style", "Fill|Lines", 0) | 4*ParamToggle("Z-order", "On top|Behind", 1 ) );
Plot(segments, "", colorLightGrey, styleHistogram | styleOwnScale );
_SECTION_END();
9 comments
Leave Comment
Please login here to leave a comment.
error in line 61
No errors at all.Thanks for this code.
syntax error@ln61&63
There are absolutely NO ERRORS in this code. You guys check your AmiBroker and update it please!!
error synatax
could you help me to get that indicator > every time i try to get failed . what is the prosedure to get formula?
@mahmoud use the “Copy & Paste Friendly” link to get the formula.
Hello magicTH
Congratulation…Good work . Plotted perfectly…small request can you please add buy-sell signals
i.e
buy= price crossing stddev_1_pos , stddev_2_pos
sell = price crossing stddev_1_neg , stddev_2_neg
*sorry for trouble
Thank you
Nice Job. Thank you.