Time Channel for Amibroker (AFL)
Neo over 14 years ago Amibroker (AFL)
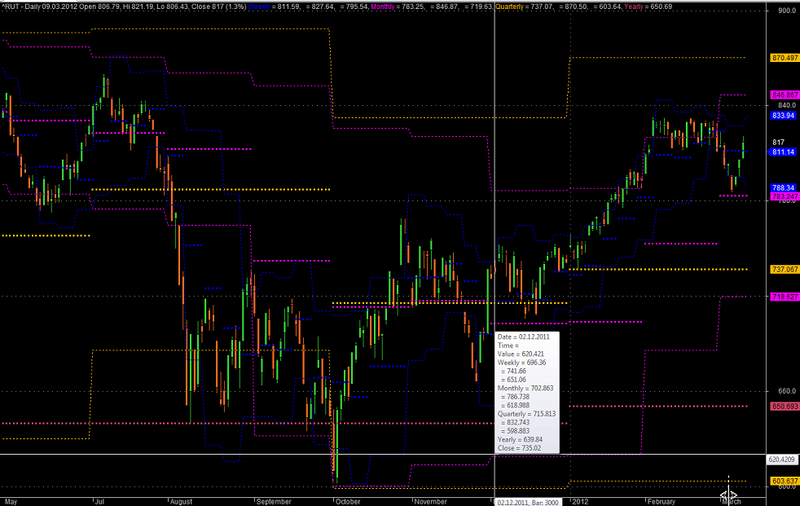
Time channels. Pivot levels of different time frames – Weekly, Monthly, Quarterly, Yearly.
For a better understanding of the strategy read Frank Dilernia.
Screenshots
Indicator / Formula
Copy & Paste Friendly
_SECTION_BEGIN("Weekly");
TimeFrameSet( inWeekly);

Piv = ( HHV(H, 3) + LLV(L, 3) + C )/3 ;
HL = ( HHV(H, 3) - LLV(L, 3) )/2 ;
up = Piv + HL ;
dn = Piv - HL ;

TimeFrameRestore();

Plot( TimeFrameExpand( Piv, inWeekly), "Weekly", colorBlue, styleDots|styleNoLine, Null, Null, 1 );
Plot( TimeFrameExpand( up, inWeekly),  " ", colorBlue, styleDashed, Null, Null, 1 );
Plot( TimeFrameExpand( dn, inWeekly), " ", colorBlue, styleDashed, Null, Null, 1 );

_SECTION_END();


_SECTION_BEGIN("Monthly");
 TimeFrameSet( inMonthly);

Piv = ( HHV(H, 3) + LLV(L, 3) + C )/3 ;
HL = ( HHV(H, 3) - LLV(L, 3) )/2 ;
up = Piv + HL ;
dn = Piv - HL ;

TimeFrameRestore();

Plot( TimeFrameExpand( piv, inMonthly), "Monthly", colorCustom12, styleDots|styleNoLine, Null, Null, 1 );
Plot( TimeFrameExpand( up, inMonthly),  " ", colorCustom12, styleDashed, Null, Null, 1 );
Plot( TimeFrameExpand( dn, inMonthly), " ", colorCustom12, styleDashed, Null, Null, 1 );

_SECTION_END();

_SECTION_BEGIN("Quarterly");
 TimeFrameSet( inQuarterly);

Piv = ( HHV(H, 3) + LLV(L, 3) + C )/3 ;
HL = ( HHV(H, 3) - LLV(L, 3) )/2 ;
up = Piv + HL ;
dn = Piv - HL ;

TimeFrameRestore();

Plot( TimeFrameExpand( piv, inQuarterly), "Quarterly", colorCustom10, styleDots|styleNoLine, Null, Null, 1 );
Plot( TimeFrameExpand( up, inQuarterly),  " ", colorCustom10, styleDashed, Null, Null, 1 );
Plot( TimeFrameExpand( dn, inQuarterly), " ", colorCustom10, styleDashed, Null, Null, 1 );

_SECTION_END();

_SECTION_BEGIN("Yearly");
 TimeFrameSet( inYearly);

Piv = ( HHV(H, 3) + LLV(L, 3) + C )/3 ;
HL = ( HHV(H, 3) - LLV(L, 3) )/2 ;
up = Piv + HL ;
dn = Piv - HL ;


TimeFrameRestore();

Plot( TimeFrameExpand( piv, inYearly), "Yearly", colorCustom16, styleDots|styleNoLine, Null, Null, 1 );
//Plot( TimeFrameExpand( up, inYearly),  " ", colorCustom16, styleDashed, Null, Null, 1 );
//Plot( TimeFrameExpand( dn, inYearly), " ", colorCustom16, styleDashed, Null, Null, 1 );

_SECTION_END();
1 comments
Leave Comment
Please login here to leave a comment.
This system excellent!!!. I have changed the arrangement of the line styles and colors as I like them and recommend systems : Year,Quarter and Month for the Daily and Weekly analysis, Y,Q,M and W for the Daily Time-frame, Month,Week,Day and Hour system for Hourly, 30Min or 15Min time-frames is good(for day-trading).Many things can be done with this code. Thanks for posting-this is the best ever and no other indicators are needed at all!
For the explanation of this system – this is the site :
http://www.datafeeds.com.au/AMT_articles.html