Automatic Linear Trend Channel for Amibroker (AFL)
vargasc1 over 14 years ago Amibroker (AFL)
Another excellent indicator from Amibroker coding guru
Edward Pottasch……..enjoy. T
These are published with the
generous permission of the author. Thanks Ed.
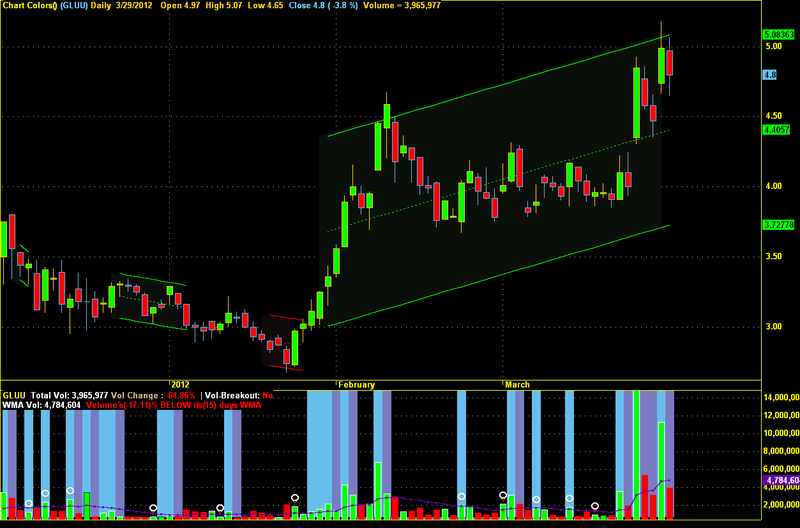
Screenshots
Indicator / Formula
Copy & Paste Friendly
// Automatic Linear Trend Channel
// Trend is defined using an example trend: MA(cp,100)
// Amibroker AFL code by Edward Pottasch, November 2011

_SECTION_BEGIN("parameters");
sdfact=Param("Standard Deviation Factor",2,0.5,5,0.1);
offset=Param("Offset",2,1,50,1);
tc=ParamList("Channel Display",List="No Channel|Channel|ChannelRT|Both Channels",1);
_SECTION_END();

function getUptrend(cp)
{
	return IIf(cp>MA(cp,100),1,0);
}
function getDowntrend(cp)
{
	return IIf(cp<=MA(cp,100),-1,0);
}

// trend definition
cp=(H+L)/2;
TrendUp=getUptrend(cp);
TrendDown=getDowntrend(cp);
totalTrend=IIf(TrendUp,TrendUp,TrendDown);
dtotalTrend=totalTrend-Ref(totalTrend,-1);
vtotalTrend=ValueWhen(dtotalTrend,dtotalTrend);

// definition start points up and down trend
cbull=vtotalTrend>0 AND Ref(vtotalTrend,-1)<0;cbull=Ref(cbull,1);
cbear=vtotalTrend<0 AND Ref(vtotalTrend,-1)>0;cbear=Ref(cbear,1);
cbull=vtotalTrend>0 AND Ref(vtotalTrend,-1)<0;cbull=Ref(cbull,1);cbull[BarCount-1]=1;
cbear=vtotalTrend<0 AND Ref(vtotalTrend,-1)>0;cbear=Ref(cbear,1);cbear[BarCount-1]=1;

// definition areas up and down trend
nwbull=Ref(Flip(cbull,cbear),-1);nwbear=Ref(Flip(cbear,cbull),-1);

xxbull=BarsSince(cbull);xxbull[BarCount-1]=xxbull[BarCount-2]+1;
aaabull=LinRegIntercept(cp,xxbull);bbbbull=LinRegSlope(cp,xxbull);
daabull=Ref(ValueWhen(cbear,aaabull,0),-1);dbbbull=Ref(ValueWhen(cbear,bbbbull,0),-1);
yybull=daabull+dbbbull*(xxbull-1);yybull=IIf(xxbull>Max(offset,1),yybull,Null);
wdbull=sdfact*StdErr(cp,xxbull);wdbull=Ref(ValueWhen(cbear,wdbull,0),-1);

xxbear=BarsSince(cbear);xxbear[BarCount-1]=xxbear[BarCount-2]+1;
aaabear=LinRegIntercept(cp,xxbear);bbbbear=LinRegSlope(cp,xxbear);
daabear=Ref(ValueWhen(cbull,aaabear,0),-1);dbbbear=Ref(ValueWhen(cbull,bbbbear,0),-1);
yybear=daabear+dbbbear*(xxbear-1);yybear=IIf(xxbear>Max(offset,1),yybear,Null);
wdbear=sdfact*StdErr(cp,xxbear);wdbear=Ref(ValueWhen(cbull,wdbear,0),-1);

llbull=LinearReg(cp,xxbull);llbull=IIf(xxbull>Max(Offset,1),llbull,Null);
llbullp=LinearReg(cp,xxbull)+sdfact*StdErr(cp,xxbull);llbullp=IIf(xxbull>Max(Offset,2),llbullp,Null);
llbullm=LinearReg(cp,xxbull)-sdfact*StdErr(cp,xxbull);llbullm=IIf(xxbull>Max(Offset,2),llbullm,Null);
llbear=LinearReg(cp,xxbear);llbear=IIf(xxbear>Max(Offset,1),llbear,Null);
llbearp=LinearReg(cp,xxbear)+sdfact*StdErr(cp,xxbear);llbearp=IIf(xxbear>Max(Offset,2),llbearp,Null);
llbearm=LinearReg(cp,xxbear)-sdfact*StdErr(cp,xxbear);llbearm=IIf(xxbear>Max(Offset,2),llbearm,Null);

_SECTION_BEGIN("Chart Colors");
SetChartBkColor(ParamColor("Background Color",colorBlack));
SetChartOptions(0,chartShowDates);
SetBarFillColor(IIf(C>O,ParamColor("Candle UP Color",colorGreen),IIf(C<=O,ParamColor("Candle Down Color",colorRed),colorLightGrey)));
Plot(C,"Price",IIf(C>O,ParamColor("Wick UP Color",colorDarkGreen),IIf(C<=O,ParamColor("Wick Down Color",colorDarkRed),colorLightGrey)),64,0,0,0,0);

switch(tc)
{
case("No Channel"):
break;
case("Channel"):
Plot(IIf(nwbull,yybull,Null),"",bbb=ColorRGB(0,255,0),styleDashed);
Plot(IIf(nwbull,yybull+wdbull,Null),"",bbb,styleThick);
Plot(IIf(nwbull,yybull-wdbull,Null),"",bbb,styleThick);
Plot(IIf(nwbear,yybear,Null),"",sss=ColorRGB(255,0,0),styleDashed);
Plot(IIf(nwbear,yybear+wdbear,Null),"",sss,styleThick);
Plot(IIf(nwbear,yybear-wdbear,Null),"",sss,styleThick);
PlotOHLC(IIf(nwbull,yybull+wdbull,Null),IIf(nwbull,yybull+wdbull,Null),IIf(nwbull,yybull-wdbull,Null),
IIf(nwbull,yybull-wdbull,Null),"",ColorRGB(10,15,10),styleCloud|styleNoLabel,0,0,0,-1);
PlotOHLC(IIf(nwbear,yybear+wdbear,Null),IIf(nwbear,yybear+wdbear,Null),IIf(nwbear,yybear-wdbear,Null),
IIf(nwbear,yybear-wdbear,Null),"",ColorRGB(15,10,10),styleCloud|styleNoLabel,0,0,0,-1);
break;
case("ChannelRT"):
Plot(IIf(nwbull,llbull,Null),"",colorGreen,styleDashed,0,1,0,1);
Plot(IIf(nwbull,llbullp,Null),"",colorGreen,styleDashed,0,1,0,1);
Plot(IIf(nwbull,llbullm,Null),"",colorGreen,styleDashed,0,1,0,1);
Plot(IIf(nwbear,llbear,Null),"",colorRed,styleDashed,0,1,0,1);
Plot(IIf(nwbear,llbearp,Null),"",colorRed,styleDashed,0,1,0,1);
Plot(IIf(nwbear,llbearm,Null),"",colorRed,styleDashed,0,1,0,1);
PlotOHLC(IIf(nwbull,llbullp,Null),IIf(nwbull,llbullp,Null),IIf(nwbull,llbullm,Null),
IIf(nwbull,llbullm,Null),"",ColorRGB(10,15,10),styleCloud|styleNoLabel,0,0,0,-1);
PlotOHLC(IIf(nwbear,llbearp,Null),IIf(nwbear,llbearp,Null),IIf(nwbear,llbearm,Null),
IIf(nwbear,llbearm,Null),"",ColorRGB(15,10,10),styleCloud|styleNoLabel,0,0,0,-1);
break;
case("Both Channels"):
Plot(IIf(nwbull,yybull,Null),"",bbb=ColorRGB(0,255,0),styleLine);
Plot(IIf(nwbull,yybull+wdbull,Null),"",bbb,styleThick);
Plot(IIf(nwbull,yybull-wdbull,Null),"",bbb,styleThick);
Plot(IIf(nwbear,yybear,Null),"",sss=ColorRGB(255,0,0),styleLine);
Plot(IIf(nwbear,yybear+wdbear,Null),"",sss,styleThick);
Plot(IIf(nwbear,yybear-wdbear,Null),"",sss,styleThick);
Plot(IIf(nwbull,llbull,Null),"",colorGreen,styleDashed,0,1,0,1);
Plot(IIf(nwbull,llbullp,Null),"",colorGreen,styleDashed,0,1,0,1);
Plot(IIf(nwbull,llbullm,Null),"",colorGreen,styleDashed,0,1,0,1);
Plot(IIf(nwbear,llbear,Null),"",colorRed,styleDashed,0,1,0,1);
Plot(IIf(nwbear,llbearp,Null),"",colorRed,styleDashed,0,1,0,1);
Plot(IIf(nwbear,llbearm,Null),"",colorRed,styleDashed,0,1,0,1);
break;
}
_SECTION_END();
6 comments
Leave Comment
Please login here to leave a comment.
REAL AMIBROKER GURU EDWARD POTTASCH.FANTASTIC AND SIMPLY SUPERB AND ONCE AGAIN NO WORDS TO SAY THANKS A BILLION.
PRASAD
THANKS A LOT BRO.if it is possible then please share your volume afl .thanks in advance
The volume indicator is available on this site. "Volume Spiker by Southwind’.
error in code, to many arguments not load in amibroker…
Can someone write Buy sell signals for this AFL. I have been looking all around. Buy when price cross upper channel line and sell when price cross lower trend line.
Thanks in advance
my email sushilsaini2004@gmail.com
It appears there is another version, saw it in a forum
// Automatic Linear Trend Channel (edited)
// original author Edward Pottasch
// Trend is defined using code found on the net
// see also: http://www.youtube.com/watch?v=HWPSqwEkN64
// Amibroker AFL code by Edward Pottasch, November 2011
// edited by Anderson Wilson, July 2012
// some symbols makes yybull and yybear infinite,
// added IsFinite(yybull) AND IsFinite(yybear)
// before plotting Channel
_SECTION_BEGIN(“Parameters”);
.
.
.
http://www.traderji.com/amibroker/103501-alf.html