Three Period Time & Price Ranges for Amibroker (AFL)
GeneRichards over 14 years ago Amibroker (AFL)
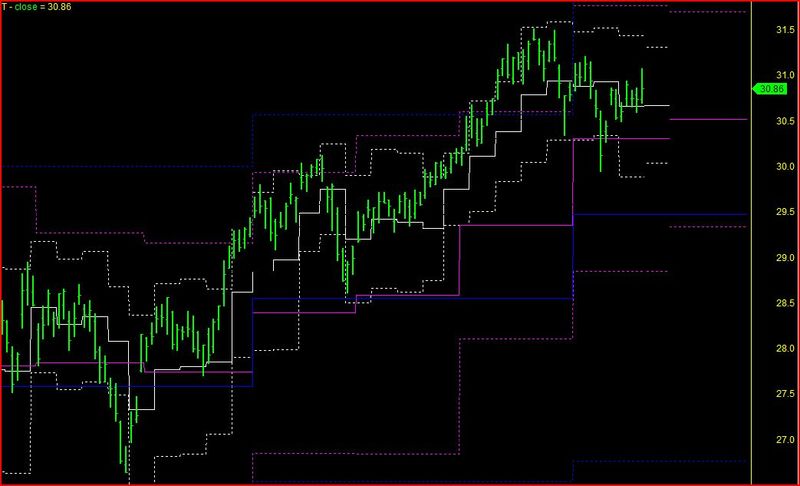
Plots 3 week, 3 month and 3 quarter time and price ranges as described in Frank Dilernia’s Book ‘The Trader Trading’
The formula let’s you look forward to the next periods levels by setting the number of days left in the current period.
Probably could be done a lot more elegantly, but the best I could do with my coding capabilities.
Colored for black background.
Screenshots
Indicator / Formula
Copy & Paste Friendly
Plot(C,"close",colorBrightGreen,styleBar|styleThick);

_SECTION_BEGIN("range 3 Qtr");
Hi1 = IIf(Month()!=Ref(Month(),-1) AND (Month()==4 OR Month()==7 OR Month()==10 OR Month()==1),Ref(HighestSince(Month()!=Ref(Month(),-1),H,9),-1),0);
Hi = ValueWhen(Month()!=Ref(Month(),-1) AND (Month()==4 OR Month()==7 OR Month()==10 OR Month()==1),Hi1,1);
Lo1 = IIf(Month()!=Ref(Month(),-1) AND (Month()==4 OR Month()==7 OR Month()==10 OR Month()==1),Ref(LowestSince(Month()!=Ref(Month(),-1),L,9),-1),0);
Lo = ValueWhen(Month()!=Ref(Month(),-1) AND (Month()==4 OR Month()==7 OR Month()==10 OR Month()==1),Lo1,1);
Cl1 = IIf(Month()!=Ref(Month(),-1) AND (Month()==4 OR Month()==7 OR Month()==10 OR Month()==1),Ref(C,-1),0);
Cl = ValueWhen(Month()!=Ref(Month() ,-1)AND (Month()==4 OR Month()==7 OR Month()==10 OR Month()==1),Cl1,1);

rg = (Hi - Lo);
bp = (Hi + Lo + Cl)/3;
rh = bp + (rg*0.5);
rl = bp - (rg*0.5);
rh1 = bp + (rg*0.61);
rl1 = bp - (rg*0.61);
rh2 = bp + rg;
rl2 = bp - rg;;


Plot(bp,"",colorBlue,styleStaircase|styleNoLabel|styleNoRescale);
Plot(rh,"",colorBlue,styleStaircase|styleDashed|styleNoLabel|styleNoRescale);
Plot(rl,"",colorBlue,styleStaircase|styleDashed|styleNoLabel|styleNoRescale);
//Plot(rh1,"",colorblue,stylestylestaircase|stylenolabel|styleNoRescale);
//Plot(rl1,"",colorblue,stylestylestaircase|stylenolabel|styleNoRescale);
//Plot(rh2,"",colorblue,stylestylestaircase|stylenolabel|styleNoRescale);
//Plot(rl2,"",colorblue,stylestylestaircase|stylenolabel|styleNoRescale);


x =Param("forward",20,0,20,1);
Plot(LastValue(bp),"",colorBlack,styleStaircase|styleNoLabel|styleNoRescale);
Plot(LastValue(rh),"",colorBlack,styleStaircase|styleDashed|styleNoLabel|styleNoRescale);
Plot(LastValue(rl),"",colorBlack,styleStaircase|styleDashed|styleNoLabel|styleNoRescale);
Plot(LastValue(bp),"",colorBlue,styleStaircase|styleNoLabel|styleNoRescale, Null, Null, x);
Plot(LastValue(rh),"",colorBlue,styleStaircase|styleDashed|styleNoLabel|styleNoRescale, Null, Null, x);
Plot(LastValue(rl),"",colorBlue,styleStaircase|styleDashed|styleNoLabel|styleNoRescale, Null, Null, x);
Hi1 = HighestSince(Month()!=Ref(Month(),-1) AND (Month()==4 OR Month()==7 OR Month()==10 OR Month()==1),H,3);
Hi = ValueWhen(Month()!=Ref(Month(),-1) AND (Month()==4 OR Month()==7 OR Month()==10 OR Month()==1),Hi1,1);
Lo1 = LowestSince(Month()!=Ref(Month(),-1) AND (Month()==4 OR Month()==7 OR Month()==10 OR Month()==1),L,3);
Lo = ValueWhen(Month()!=Ref(Month(),-1) AND (Month()==4 OR Month()==7 OR Month()==10 OR Month()==1),Lo1,1);
Cl1 = IIf(Month()!=Ref(Month(),-1) AND (Month()==4 OR Month()==7 OR Month()==10 OR Month()==1),Ref(C,-1),0);
Cl = C;

rg = (Hi1 - Lo1);
bp = (Hi1 + Lo1 + Cl)/3;
rh = bp + (rg*0.5);
rl = bp - (rg*0.5);
rh1 = bp + (rg*0.61);
rl1 = bp - (rg*0.61);
rh2 = bp + rg;
rl2 = bp - rg;;


Plot(LastValue(bp),"",colorBlack,styleStaircase|styleNoLabel|styleNoRescale, Null, Null, x);
Plot(LastValue(rh),"",colorBlack,styleStaircase|styleDashed|styleNoLabel|styleNoRescale, Null, Null, x);
Plot(LastValue(rl),"",colorBlack,styleStaircase|styleDashed|styleNoLabel|styleNoRescale, Null, Null, x);
Plot(LastValue(bp),"",colorBlue,styleStaircase|styleNoLabel|styleNoRescale, Null, Null, 20);
Plot(LastValue(rh),"",colorBlue,styleStaircase|styleDashed|styleNoLabel|styleNoRescale, Null, Null, 20);
Plot(LastValue(rl),"",colorBlue,styleStaircase|styleDashed|styleNoLabel|styleNoRescale, Null, Null, 20);
_SECTION_END();

_SECTION_BEGIN("ranges 3 month fwd");

Hi1 = IIf(Month()!=Ref(Month(),-1),Ref(HighestSince(Month()!=Ref(Month(),-1),H,3),-1),0);
Hi = ValueWhen(Month()!=Ref(Month(),-1),Hi1,1);
Lo1 = IIf(Month()!=Ref(Month(),-1),Ref(LowestSince(Month()!=Ref(Month(),-1),L,3),-1),0);
Lo = ValueWhen(Month()!=Ref(Month(),-1),Lo1,1);
Cl1 = IIf(Month()!=Ref(Month(),-1),Ref(C,-1),0);
Cl = ValueWhen(Month()!=Ref(Month(),-1),Cl1,1);rg = (Hi - Lo);

rg = (Hi - Lo);
bp = (Hi + Lo + Cl)/3;
rh = bp + (rg*0.5);
rl = bp - (rg*0.5);
rh1 = bp + (rg*0.61);
rl1 = bp - (rg*0.61);
rh2 = bp + rg;
rl2 = bp - rg;;


Plot(bp,"",colorCustom12,styleStaircase|styleNoLabel|styleNoRescale);
Plot(rh,"",colorCustom12,styleStaircase|styleDashed|styleNoLabel|styleNoRescale);
Plot(rl,"",colorCustom12,styleStaircase|styleDashed|styleNoLabel|styleNoRescale);
//Plot(rh1,"",colorcustom12,stylestylestaircase|stylenolabel|styleNoRescale);
//Plot(rl1,"",colorcustom12,stylestylestaircase|stylenolabel|styleNoRescale);
//Plot(rh2,"",colorCustom12,stylestylestaircase|stylenolabel|styleNoRescale);
//Plot(rl2,"",colorCustom12,stylestylestaircase|stylenolabel|styleNoRescale);


x =Param("forward",20,0,20,1);
Plot(LastValue(bp),"",colorBlack,styleStaircase|styleNoLabel|styleNoRescale);
Plot(LastValue(rh),"",colorBlack,styleStaircase|styleDashed|styleNoLabel|styleNoRescale);
Plot(LastValue(rl),"",colorBlack,styleStaircase|styleDashed|styleNoLabel|styleNoRescale);
Plot(LastValue(bp),"",colorCustom12,styleStaircase|styleNoLabel|styleNoRescale, Null, Null, x);
Plot(LastValue(rh),"",colorCustom12,styleStaircase|styleDashed|styleNoLabel|styleNoRescale, Null, Null, x);
Plot(LastValue(rl),"",colorCustom12,styleStaircase|styleDashed|styleNoLabel|styleNoRescale, Null, Null, x);

Hi1 = HighestSince(Month()!=Ref(Month(),-1),H,3);
Hi = ValueWhen(Month()!=Ref(Month(),-1),Hi1,1);
Lo1 = LowestSince(Month()!=Ref(Month(),-1),L,3);
Lo = ValueWhen(Month()!=Ref(Month(),-1),Lo1,1);
Cl1 = IIf(Month()!=Ref(Month(),-1),Ref(C,-1),0);
Cl = C;

rg = (Hi1 - Lo1);
bp = (Hi1 + Lo1 + Cl)/3;
rh = bp + (rg*0.5);
rl = bp - (rg*0.5);
rh1 = bp + (rg*0.61);
rl1 = bp - (rg*0.61);
rh2 = bp + rg;
rl2 = bp - rg;;


Plot(LastValue(bp),"",colorBlack,styleStaircase|styleNoLabel|styleNoRescale, Null, Null, x);
Plot(LastValue(rh),"",colorBlack,styleStaircase|styleDashed|styleNoLabel|styleNoRescale, Null, Null, x);
Plot(LastValue(rl),"",colorBlack,styleStaircase|styleDashed|styleNoLabel|styleNoRescale, Null, Null, x);
Plot(LastValue(bp),"",colorCustom12,styleStaircase|styleNoLabel|styleNoRescale, Null, Null, 20);
Plot(LastValue(rh),"",colorCustom12,styleStaircase|styleDashed|styleNoLabel|styleNoRescale, Null, Null, 20);
Plot(LastValue(rl),"",colorCustom12,styleStaircase|styleDashed|styleNoLabel|styleNoRescale, Null, Null, 20);
_SECTION_END();

_SECTION_BEGIN("ranges 3 week");
Hi1 = IIf(DayOfWeek()<Ref(DayOfWeek(),-1),Ref(HighestSince(DayOfWeek()<Ref(DayOfWeek(),-1),H,3),-1),0);
Hi = ValueWhen(DayOfWeek()<Ref(DayOfWeek(),-1),Hi1,1);
Lo1 = IIf(DayOfWeek()<Ref(DayOfWeek(),-1),Ref(LowestSince(DayOfWeek()<Ref(DayOfWeek(),-1),L,3),-1),0);
Lo = ValueWhen(DayOfWeek()<Ref(DayOfWeek(),-1),Lo1,1);
Cl1 = IIf(DayOfWeek()<Ref(DayOfWeek(),-1),Ref(C,-1),0);
Cl = ValueWhen(DayOfWeek()<Ref(DayOfWeek(),-1),Cl1,1);

rg = (Hi - Lo);
bp = (Hi + Lo + Cl)/3;
rh = bp + (rg*0.5);
rl = bp - (rg*0.5);
rh1 = bp + (rg*0.61);
rl1 = bp - (rg*0.61);
rh2 = bp + rg;
rl2 = bp - rg;;


Plot(bp,"",colorWhite,styleStaircase|styleNoLabel|styleNoRescale);
Plot(rh,"",colorWhite,styleStaircase|styleDashed|styleNoLabel|styleNoRescale);
Plot(rl,"",colorWhite,styleStaircase|styleDashed|styleNoLabel|styleNoRescale);
//Plot(rh1,"",colorWhite,stylestylestaircase|stylenolabel|styleNoRescale);
//Plot(rl1,"",colorWhite,stylestylestaircase|stylenolabel|styleNoRescale);
//Plot(rh2,"",colorCustom12,stylestylestaircase|stylenolabel|styleNoRescale);
//Plot(rl2,"",colorCustom12,stylestylestaircase|stylenolabel|styleNoRescale);


x =Param("forward",5,0,5,1);
Plot(LastValue(bp),"",colorBlack,styleStaircase|styleNoLabel|styleNoRescale);
Plot(LastValue(rh),"",colorBlack,styleStaircase|styleDashed|styleNoLabel|styleNoRescale);
Plot(LastValue(rl),"",colorBlack,styleStaircase|styleDashed|styleNoLabel|styleNoRescale);
Plot(LastValue(bp),"",colorWhite,styleStaircase|styleNoLabel|styleNoRescale, Null, Null, x);
Plot(LastValue(rh),"",colorWhite,styleStaircase|styleDashed|styleNoLabel|styleNoRescale, Null, Null, x);
Plot(LastValue(rl),"",colorWhite,styleStaircase|styleDashed|styleNoLabel|styleNoRescale, Null, Null, x);


Hi1 = HighestSince(DayOfWeek()<Ref(DayOfWeek(),-1),H,3);
Hi = ValueWhen(DayOfWeek()<Ref(DayOfWeek(),-1),Hi1,1);
Lo1 = LowestSince(DayOfWeek()<Ref(DayOfWeek(),-1),L,3);
Lo = ValueWhen(DayOfWeek()<Ref(DayOfWeek(),-1),Lo1,1);
Cl1 = IIf(DayOfWeek()<Ref(DayOfWeek(),-1),Ref(C,-1),0);
Cl = C;

rg = (Hi1 - Lo1);
bp = (Hi1 + Lo1 + Cl)/3;
rh = bp + (rg*0.5);
rl = bp - (rg*0.5);
rh1 = bp + (rg*0.61);
rl1 = bp - (rg*0.61);
rh2 = bp + rg;
rl2 = bp - rg;;


Plot(LastValue(bp),"",colorBlack,styleStaircase|styleNoLabel|styleNoRescale, Null, Null, x);
Plot(LastValue(rh),"",colorBlack,styleStaircase|styleDashed|styleNoLabel|styleNoRescale, Null, Null, x);
Plot(LastValue(rl),"",colorBlack,styleStaircase|styleDashed|styleNoLabel|styleNoRescale, Null, Null, x);
Plot(LastValue(bp),"",colorWhite,styleStaircase|styleNoLabel|styleNoRescale, Null, Null, 5);
Plot(LastValue(rh),"",colorWhite,styleStaircase|styleDashed|styleNoLabel|styleNoRescale, Null, Null, 5);
Plot(LastValue(rl),"",colorWhite,styleStaircase|styleDashed|styleNoLabel|styleNoRescale, Null, Null, 5);
_SECTION_END();
1 comments
Leave Comment
Please login here to leave a comment.
That what is visible is exactly the same as was posted by somebody else but much more simpler. Simple (H+L+C)/3
in different TimeFrame set and TimeFrameExpand will result with the same thing as was posted by somebody else here before. Can you do 2-Day SD Channel? I can’t post it as per copyright of Frank Dilernia. There is also 5-Day pattern in the book for Day Trading.