Net Lines for Amibroker (AFL)
carlvan about 14 years ago Amibroker (AFL)
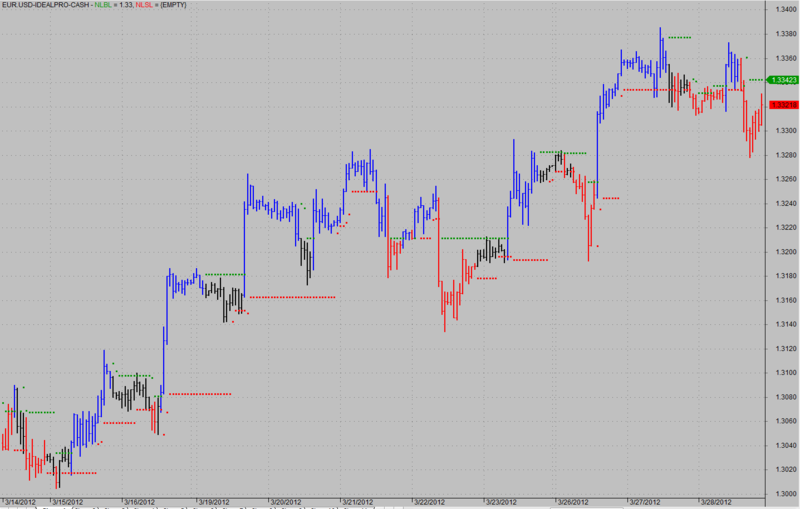
I don’t remember the name of the trader who found this, but basically the philosophy of this very simple system is that when you have 3 consecutive higher close, you will mark the low of the first bar of the sequence by a dot on the chart. That is a NLSL (net sell line), and the opposite is a NLBL line (net buy line).
As long as there is no higher and more recent similar “3 higher close” sequence, the dots will remain horizontal. When a new higher sewuence occurs, new dot will be placed at the low of the new sequence, and so forth.
Same for bearish sequence. The thing is: when price breaks and closes beyond a dot, you have a reversal signal, or at least an exit for current position.
If you want stronger signal, you can just change the “3” consecutive by 4 or even 5: less frequent but probably stronger signals will ensue.
Note the color of the bar: when the bar is in between 2 opposite net lines, the color is black= neutral and consolidating. Otherwise, it clearly indicates the direction to follow.
Screenshots
Indicator / Formula
_SECTION_BEGIN("NetLines");

netbull= Sum(C<Ref(C,-1),3)==3;
netbear= Sum(C>Ref(C,-1),3)==3;

NLBL= ValueWhen(netbull,Ref(H,-2));
NLSL= ValueWhen(netbear,Ref(L,-2));

netline=IIf(BarsSince(NLBL)<BarsSince(NLSL),NLBL, NLSL);
Color= IIf(netline==NLBL,colorBlue, colorRed);

Plot(IIf(Ref(C,-1)< NLBL,NLBL,Null),"NLBL",colorBlue,styleDots|styleNoLine|styleThick);
Plot(IIf(Ref(C,-1)> NLSL,NLSL,Null),"NLSL",colorRed,styleDots|styleNoLine|styleThick);

Couleur= IIf(C> NLBL, colorBlue, IIf(C<NLSL, colorRed, colorBlack));
Plot( C, "Close", couleur, styleNoTitle | ParamStyle("Style") | GetPriceStyle() );

if( ParamToggle("Tooltip shows", "All Values|Only Prices" ) )
{
 ToolTip=StrFormat("Open: %g\nHigh:  %g\nLow:   %g\nClose:  %g (%.1f%%)\nVolume: "+NumToStr( V, 1 ), O, H, L, C, SelectedValue( ROC( C, 1 )));
}
_SECTION_END();
11 comments
Leave Comment
Please login here to leave a comment.
this is the nice code. lill safer to trade. coz u will find the signal right when the trend is already set.
just for the better appearance u can add the following code at the end of ur code :
FS=Param(“Font Size”,30,11,100,1);
GfxSelectFont(“Times New Roman”, FS, 700, True );
GfxSetBkMode( colorBlack );
GfxSetTextColor( ParamColor(“Color”,colorBlack) );
Hor=Param(“Horizontal Position”,890,1,1200,1);
Ver=Param(“Vertical Position”,12,1,830,1);
GfxTextOut(""+C, Hor , Ver );
YC=TimeFrameGetPrice(“C”,inDaily,-1);
DD=Prec(C-YC,2);
xx=Prec((DD/YC)*100,2);
GfxSelectFont(“Times New Roman”, 11, 700, True );
GfxSetBkMode( colorBlack );
GfxSetTextColor(ParamColor(“Color”,colorYellow) );
GfxTextOut(""+DD+" (“xx”%)", Hor , Ver+45 );
thanx !
Rohan Patel
rhn_patel@rediffmail.com
Thanks Rohan, I like your added code as well. What I forgot to mention is that this “net lines” setup in fact coincides more or less with the well know candle formation called “3 little soldiers”, which in my opinion adds to its validity. I personnally use the net lines in my trading, as a trigger when I get a signal from other favorite indicators.
Thank you for the indicator. This could used for turtle trading.
4. Dick
Most interesting. Could you provide Buy – Sell formulas based on Price breaking Trend ? so I could set up Exploration Thanks. Also I couldn’t get the added Graphics to work (came up with error message).
You response will be appreciated.
Hellow Carlvan,
My appraciation & deep regards for you as you are sharing this exellent code. This is one of the superb AFL i have come across.
And also many thanks to the author and wisestocktrader.com
Thanks
Viswanath
Rohan Patel friend can u edit complete AFL please becouse i am finding syntax error, thanks a lot!!
The corrected afl submitted by extremist……………….
FS=Param(“Font Size”,30,11,100,1);
GfxSelectFont(“Times New Roman”, FS, 700, True );
GfxSetBkMode( colorBlack );
GfxSetTextColor( ParamColor(“Color”,colorWhite) );
Hor=Param(“Horizontal Position”,890,1,1200,1);
Ver=Param(“Vertical Position”,12,1,830,1);
GfxTextOut(""+C, Hor , Ver );
YC=TimeFrameGetPrice(“C”,inDaily,-1);
DD=Prec(C-YC,2);
xx=Prec((DD/YC)*100,2);
GfxSelectFont(“Times New Roman”, 11, 700, True );
GfxSetBkMode( colorBlack );
GfxSetTextColor(ParamColor(“Color”,colorYellow) );
GfxTextOut(""+DD+" " “(”XX+")"+ “%” , Hor , Ver+45 );
To the request of Dirk, I am adding 2 lines of code for buy/sell conditions. Of course the inverse conditions applies for short/cover. However, I don’t use those conditions just like that. To me, the color change, for example a new blue bar, means the trend is about to change. THEN, I need an additional trigger. For my style of trading the trigger is a correction that will not break below the new red dots that now should stand below prices. For example you might want to wait for a lower low after an upside break then enter on the first higher high. Hope it helps.
_SECTION_BEGIN(“NetLines”);
netbull= Sum(C<Ref(C,-1),3)==3;
netbear= Sum(C>Ref(C,-1),3)==3;
NLBL= ValueWhen(netbull,Ref(H,-2));
NLSL= ValueWhen(netbear,Ref(L,-2));
netline=IIf(BarsSince(NLBL)<BarsSince(NLSL),NLBL, NLSL);
Plot(IIf(Ref(C,-1)< NLBL,NLBL,Null),“NLBL”,colorLime,styleDots|styleNoLine|styleThick);
Plot(IIf(Ref(C,-1)> NLSL,NLSL,Null),“NLSL”,colorRed,styleDots|styleNoLine|styleThick);
Couleur= IIf(C> NLBL, colorBlue, IIf(C<NLSL, colorRed, colorBlack));
Plot( C, “Close”, couleur, styleNoTitle | ParamStyle(“Style”) | GetPriceStyle() );
if( ParamToggle(“Tooltip shows”, “All Values|Only Prices” ) )
{
ToolTip=StrFormat("Open: g\nHigh: %g\nLow: %g\nClose: %g (.1f%%)\nVolume: "+NumToStr( V, 1 ), O, H, L, C, SelectedValue( ROC));
}
Buy= Cross(C,NLBL);
Sell= Cross(NLSL,C);
_SECTION_END();
error for carlvan code :-
error 31
Please find here with the code with buy/sell arrows. Buy/sell are at HH/LL.
Thanks
Viswanath
=======
For Net Lines for Amibroker (AFL): Buy/sell are added. Plz find the code herewith.