Stock Portfolio Organizer
The ultimate porfolio management solution.
Shares, Margin, CFD's, Futures and Forex
EOD and Realtime
Dividends and Trust Distributions
And Much More ....
WiseTrader Toolbox
#1 Selling Amibroker Plugin featuring:
Advanced Adaptive Indicators
Advanced Pattern Exploration
Neural Networks
And Much More ....
Support & Resistant with Exploration mode for Amibroker (AFL)
Rating:
5 / 5 (Votes 1)
Tags:
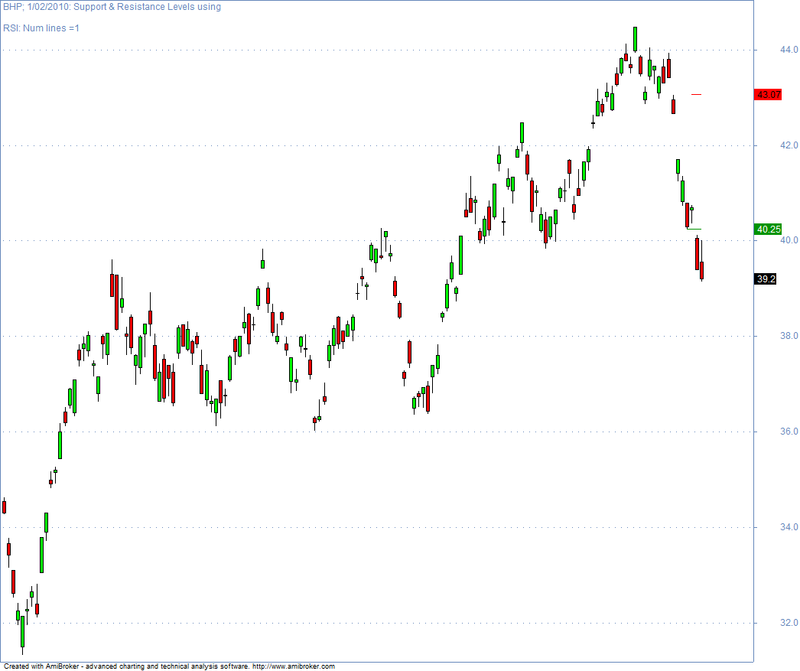
The indicator was created by graham Kavanagh May 2003.
Added an exploration mode giving you an excel spread sheet as a guide.
Screenshots
Indicator / Formula
Copy & Paste Friendly
_SECTION_BEGIN("support and resistant");

//Support and resistance levels using RSI.

//graham Kavanagh May 2003

//Load into Indicator Builder

//Sensitivity of the levels can be changed with the variables

//Can test different numbers live with the Param function ctrl-R with Open pane

RSIperiod = 5; // Param("RSI p",3,14,30,1);

Percent = 5; // Param("ZIG %",8,9,15,1);

EMAperiod = 5; //Param("EMA p",4,5,10,1);

HHVperiod = 5; //Param("HHV p",3,5,10,1);

NumLine = 1; //Param("Num Lines",3,1,20,1);


Base = DEMA(RSI(RSIperiod), EMAperiod) ;


GraphXSpace=0.5;

Plot(C,"",colorBlack,styleCandle);


for( i = 1; i <= numline; i++ )

{

ResBase = LastValue(Peak(Base,Percent, i));

SupBase = LastValue(Trough(Base,Percent, i));

Plot(ValueWhen( ResBase==Base, HHV(H,HHVperiod) ), "Resist Level",

colorRed, styleLine);

Plot(ValueWhen( supbase==Base, LLV(L,HHVperiod) ), "Support Level",

colorGreen, styleLine);

}

Title = Name() + "; " + Date() + ": Support & Resistance Levels using

RSI: " + /*EncodeColor( colorGreen) + "Support Levels are Green;

"+EncodeColor( colorRed) + "Resistance Levels are Red:

"+EncodeColor( colorBlack) +*/ "Num lines ="+WriteVal(numline, 1) ;

Filter=C>1 AND C<100 AND ResBase>=1 AND SupBase >=1;

Buy=Sell=Short=Cover=0;

AddColumn(C,"Close",1.2);

AddColumn(ValueWhen( ResBase==Base, HHV(H,HHVperiod)) ,"Resistance",1.2);

AddColumn(ValueWhen( supbase==Base, LLV(L,HHVperiod)) ,"Support",1.2);


_SECTION_END();
0 comments
Leave Comment
Please login here to leave a comment.
Back