Stock Portfolio Organizer

The ultimate porfolio management solution.

Shares, Margin, CFD's, Futures and Forex
EOD and Realtime
Dividends and Trust Distributions
And Much More ....
For Portfolio Manager Click Here

WiseTrader Toolbox

#1 Selling Amibroker Plugin featuring:

Advanced Adaptive Indicators
Advanced Pattern Exploration
Neural Networks
And Much More ....
Find Out More Here

Intermarket (Predicted) Moving Average Universal for Amibroker (AFL)
jdegange
almost 12 years ago
Amibroker (AFL)

Rating:
3 / 5 (Votes 3)
Tags:
amibroker

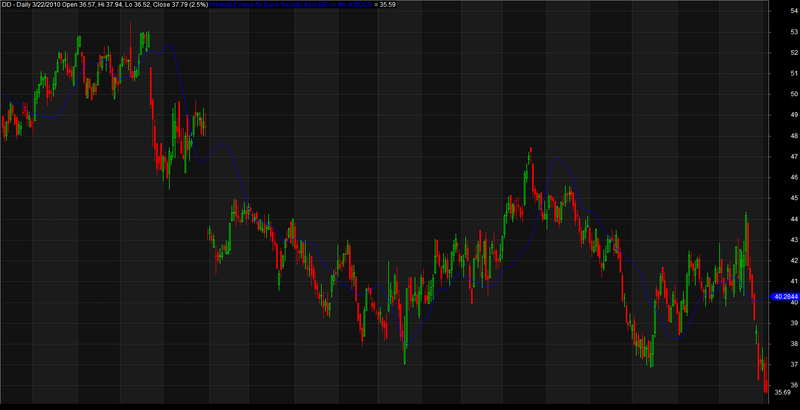
Predicted Value for Base Securtiy from LR on MA of ROC’s

Screenshots

Similar Indicators / Formulas

Kavach Of Karna v2
Submitted by hbkwarez almost 10 years ago
Advanced Elliott Waves
Submitted by MarcosEn over 12 years ago
3_6Day GuaiLiLv
Submitted by motorfly over 12 years ago
Williams Alligator System
Submitted by durgesh1712 over 12 years ago
*Level Breakout system*
Submitted by Tinych over 12 years ago
Horizontal Live Priceline Tool
Submitted by northstar over 12 years ago

Indicator / Formula

Copy & Paste Friendly
SEC2 = Foreign("^XAU","C",fixup = 1);
D3 = Param("MA PERIOD BASE SECURITY", 13, 1, 1000,1);
D1 = Param("Regression Days", 500, 1, 2000,1);
D2 = Param("ROC Days", 11, 1, 100,1);
RS1 = ROC(C,D2);
RS2 = ROC(SEC2,D2);
b = Correlation(RS1,RS2,D1)*StDev(RS1,D1)/StDev(RS2,D1);
a = MA(RS1,D1)-b*MA(RS2,D1);
PR11 = b*RS2+a;
PRED1 = Ref(C,-D2)*(1+PR11/100);
PRED = MA(PRED1,D3);
Plot(PRED,"Predicted Value for Base Securtiy from LR on MA of ROC's",colorBlue);

5 comments

1. anandnst

AFL NOT WORKING IN 5.50 AMIBROKER

2. elliot

_SECTION_BEGIN("Chart Settings");
	SetChartOptions(0,chartShowArrows|chartShowDates);
	SetChartBkColor(ParamColor("Outer Panel",colorPaleBlue)); 
	SetChartBkGradientFill(ParamColor("Upper Chart",1),ParamColor("Lower Chart",23));  
_SECTION_END();


_SECTION_BEGIN("BOŞ EKRAN");

Show_color = ParamToggle("Display CandleColor", "No|Yes", 1);
mycolor=IIf(C<Ref(C,-1) , ColorRGB(230,230,0),IIf(C>Ref(C,-1),ColorRGB(0,0,100),IIf(C==Ref(C,-1) ,colorOrange,colorDarkRed)));
mycolor1=IIf(C<Ref(C,-1),colorWhite,colorLime);


if(Show_color ==1)
{
ColorHighliter = myColor;
SetBarFillColor( ColorHighliter );

barColor=IIf(C>Ref(C,-1) ,colorAqua,IIf(C <Ref(C,-1),colorRed,colorYellow));
barColor2=IIf(Close > Open, colorWhite, colorRed);


PlotOHLC( Open, High, Low, Close, " " , barcolor, styleCandle | styleThick );
}
ColorHighliter = myColor1;
SetBarFillColor( ColorHighliter );

barColor3=IIf(C>Ref(C,-1),colorAqua,colorRed);
Plot(Close, " " , barColor3, styleBar | styleThick );

SEC2 =C;
D3 = Param("MA PERIOD BASE SECURITY", 13, 1, 1000,1);
D1 = Param("Regression Days", 500, 1, 2000,1);
D2 = Param("ROC Days", 11, 1, 100,1);
RS1 = ROC(C,D2);
RS2 = ROC(SEC2,D2);
b = Correlation(RS1,RS2,D1)*StDev(RS1,D1)/StDev(RS2,D1);
a = MA(RS1,D1)-b*MA(RS2,D1);
PR11 = b*RS2+a;
PRED1 = Ref(C,-D2)*(1+PR11/100);
PRED = MA(PRED1,D3);
Plot(PRED,"Predicted Value for Base Securtiy from LR on MA of ROC's",colorYellow,styleLine+styleDots|styleThick);


_SECTION_BEGIN("Infinite impulse response filter");

f0 = Param("F0 Katsayı :",0.2,-10,10,0.001);
f1 = Param("F1 Katsayı :",1.4,-10,10,0.001);
f2 = Param("F2 Katsayı :",-0.6,-10,10,0.001);

function IIR2( faktor, f0, f1, f2 )
{
  sonuc[ 0 ] = faktor[ 0 ];
  sonuc[ 1 ] = faktor[ 1 ]; 

  for( i = 2; i < BarCount; i++ )
  {
    sonuc[ i ] = f0 * faktor[ i ]  + f1 * sonuc[ i - 1 ] +  f2 * sonuc[ i - 2 ]; 
  }

  return sonuc;
}
Line=IIR2( Close, f0, f1, f2 );
Plot( Line, "IIR2", IIf(Line > Ref(Line, -1),colorLime,colorRed),styleLine+styleDots|styleThick);
_SECTION_END();
3. klvenkatt

actually looks real good. THANKS..

4. Foyej Ahmed Khan

what good…….! there is nothing on afl at first. where is the begin & end of the formula….! i found nothing…do u plz. help me.

5. worldastro

picture plese !!!!!

Leave Comment

Please login here to leave a comment.

Back