Stock Portfolio Organizer
The ultimate porfolio management solution.
Shares, Margin, CFD's, Futures and Forex
EOD and Realtime
Dividends and Trust Distributions
And Much More ....
WiseTrader Toolbox
#1 Selling Amibroker Plugin featuring:
Advanced Adaptive Indicators
Advanced Pattern Exploration
Neural Networks
And Much More ....
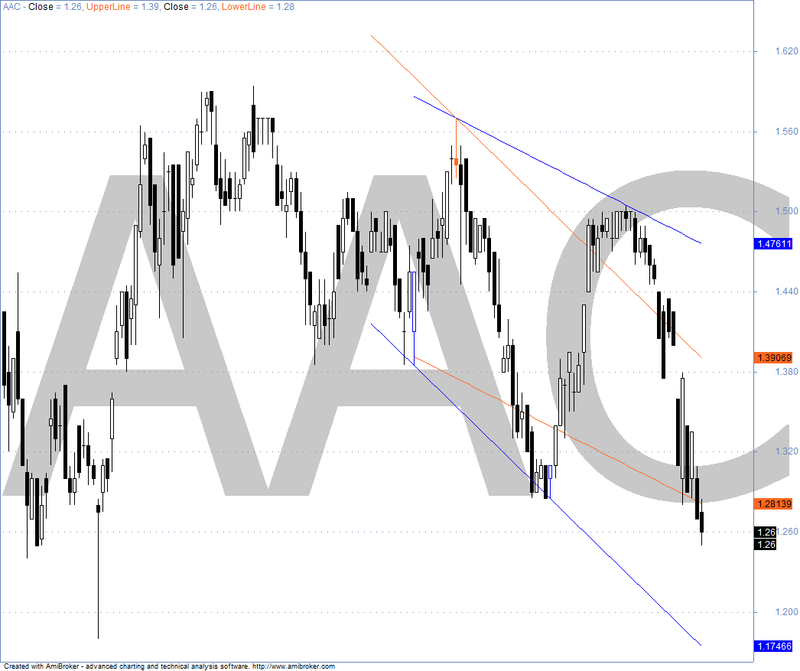
Parallel Trend Lines 2 for Amibroker (AFL)
Rating:
5 / 5 (Votes 1)
Tags:
Same as the earlier parallel line posted. This has the chart symbol in back ground
Screenshots
Indicator / Formula
Copy & Paste Friendly
_SECTION_BEGIN("Pattern Recognition Exploration 3");
GfxSetOverlayMode(1);
GfxSelectFont("Tahoma", Status("pxheight")/2 );
GfxSetTextAlign( 6 );// center alignment
GfxSetTextColor( ColorRGB( 200, 200, 200 ) );
GfxSetBkMode(1); // transparent
GfxTextOut( Name(), Status("pxwidth")/2, Status("pxheight")/12 );
// Parallel lines defined by the automatic support and the HighestBetween point
x = Cum(1);per = 3;s1=L;s11=H;
pS = TroughBars( s1, per, 1 ) == 0;
endt= LastValue(ValueWhen( pS, x, 1 ));
startt=LastValue(ValueWhen( pS, x, 2 ));
dtS =endt-startt;
endS = LastValue(ValueWhen( pS, s1, 1 ) );
startS = LastValue( ValueWhen( pS, s1, 2 ));
aS = (endS-startS)/dtS;bS = endS;
trendlineS = aS * ( x -endt ) + bS;
Plot(IIf(x>startt-10,trendlineS,-1e10),"",colorBlue,1);
H1=LastValue(Highest((Cum(1)>startt AND Cum(1)<endt)*H));
tH1=LastValue(ValueWhen(H==H1,Cum(1)));
Color=IIf((Cum(1)==startt OR Cum(1)==endt),colorBlue,IIf(Cum(1)==tH1,colorOrange,colorBlack));
Plot(C,"Close",Color,64);
UpperParallel=aS*(x-tH1)+H1;Plot(IIf(x>startt-10,UpperParallel,-1e10),"UpperLine",colorOrange,1);

// Parallel lines defined by the automatic resistance and the LowestBetween point
x = Cum(1);per = 3;s1=L;s11=H;
pR = PeakBars( s11, per, 1 ) == 0;
endt1= LastValue(ValueWhen( pR, x, 1 ));
startt1=LastValue(ValueWhen( pR, x, 2 ));
dtR =endt1-startt1;
endR = LastValue(ValueWhen( pR, s11, 1 ) );
startR = LastValue( ValueWhen( pR, s11, 2 ));
aR = (endR-startR)/dtR;
bR = endR;
trendlineR = aR * ( x -endt1 ) + bR;
Plot(IIf(x>startt1-10,trendlineR,-1e10),"",colorBlue,1);
L1=LastValue(Lowest(IIf(Cum(1)>startt1 AND Cum(1)<endt1,L,10^10)));
tL1=LastValue(ValueWhen(L==L1,Cum(1)));
Color=IIf((Cum(1)==startt1 OR Cum(1)==endt1),colorBlue,IIf(Cum(1)==tL1,colorOrange,colorBlack));
Plot(C,"Close",Color,64);
LowerParallel=aR*(x-tL1)+L1;Plot(IIf(x>startt1-10,LowerParallel,-1e10),"LowerLine",colorOrange,1);
_SECTION_END();
0 comments
Leave Comment
Please login here to leave a comment.
Back