Simple&Best for Amibroker (AFL)
samyjack about 14 years ago Amibroker (AFL)
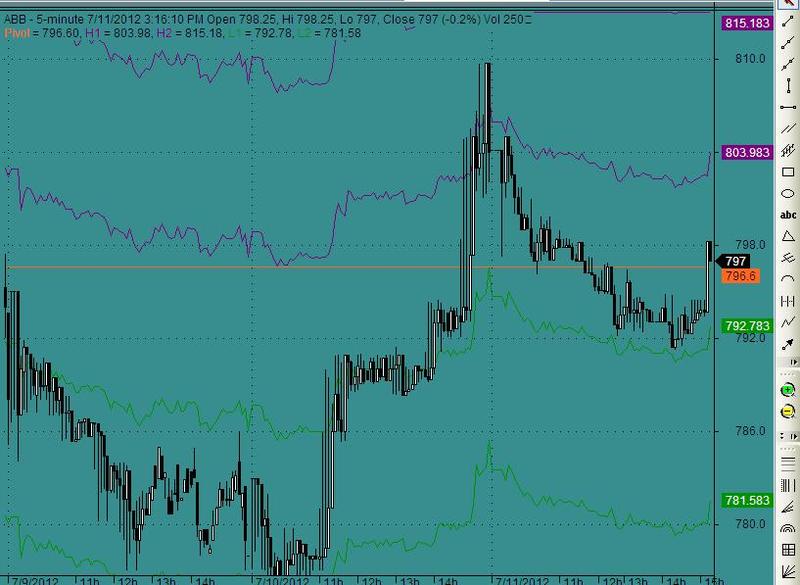
It is very simple & best, mostly successful. Buy at supports and exit at resistances. short sell at resistances and exit at supports. Two supports and two resistances. Good for stocks mostly.
Screenshots
Indicator / Formula
Copy & Paste Friendly
_SECTION_BEGIN("Intraday Pivot");
SetChartOptions(0,chartShowArrows|chartShowDates);
_N(Title = StrFormat("{{NAME}} - {{INTERVAL}} {{DATE}} Open %g, Hi %g, Lo %g, Close %g (%.1f%%) Vol " +WriteVal( V, 1.0 ) +"
{{VALUES}}", O, H, L, C, SelectedValue( ROC( C, 1 )) ));

Plot( C, "Close", ParamColor("Color", colorBlack ), styleNoTitle | ParamStyle("Style") | GetPriceStyle() );

H1=SelectedValue( TimeFrameGetPrice( "H", inDaily, -1 ));
L1=SelectedValue(TimeFrameGetPrice( "L", inDaily, -1 ));
C1=SelectedValue(TimeFrameGetPrice( "C", inDaily, -1 ));


//PP = Pr High + Pr Low + Pr Close;
//High1 = ((((Pr Close + Pr High)/2)/3)*2) + (TodayOpen /3) ;
//Low1 = ((((Pr Close + Pr Low)/2)/3)*2) + (TodayOpen /3) ;


// Pivot Point Calculation /////////
PP= (H1 + L1 + C1)/3;
High1=((((C1 + H1)/2)/3)*2) + (O /3) ;
Low1 = ((((C1 + L1)/2)/3)*2) + (O /3) ;

High2= High1 + (High1- Low1);
Low2 = Low1 - (High1- Low1);

Plot (PP,"Pivot",colorOrange,styleLine+styleNoRescale);
Plot (High1,"H1",colorViolet,styleLine|styleNoRescale);
Plot (High2,"H2",colorViolet,styleLine|styleNoRescale);

Plot (Low1,"L1",colorGreen,styleLine|styleNoRescale);
Plot (Low2,"L2",colorGreen,styleLine|styleNoRescale);

_SECTION_END();
1 comments
Leave Comment
Please login here to leave a comment.
What part of formula identifies Support … ditto Resistance. I would like to have BUY – SELL signals in formula so an Exploration could be developed
Dick @ areehoi@yahoo.com