Bollingerband with Support & Resistance System for Amibroker (AFL)
anandnst almost 14 years ago Amibroker (AFL)
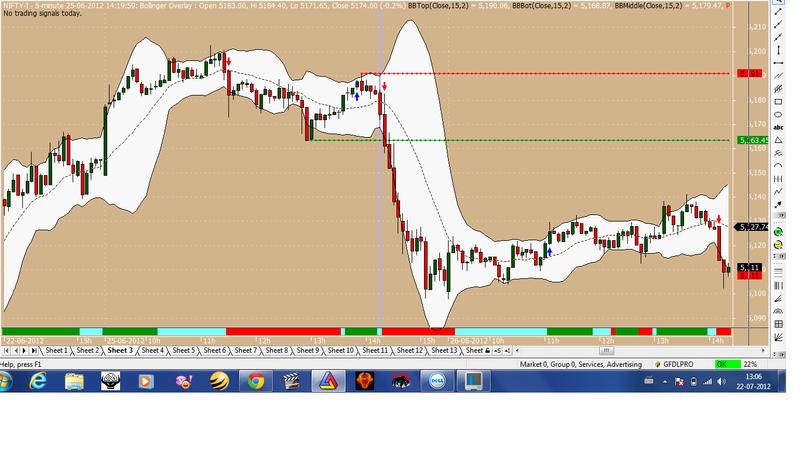
This is system of Bollinger band with Support & resistance. Also Best Buy/sell signals provided in this system. (Try this for Nifty future).
Comments are welcomed.
Screenshots
Indicator / Formula
Copy & Paste Friendly
_SECTION_BEGIN("_bollingerbands overlay");

P = ParamField("Price field",-1);
Periods = Param("Periods", 15, 2, 100, 1 );
Width = Param("Width", 2, 0, 10, 0.05 );
Color = ParamColor("Color", colorLightGrey );
Style = ParamStyle("Style", styleLine | styleNoLabel ) | styleNoLabel;
bbt = BBandTop( P, Periods, Width );
bbb = BBandBot( P, Periods, Width );
Plot( bbt , "BBTop" + _PARAM_VALUES(), colorBlack, Style );
Plot( bbb , "BBBot" + _PARAM_VALUES(), colorBlack, Style );
PlotOHLC( bbt, bbt, bbb, bbb, "", ColorBlend( Color, colorWhite, 0.9 ), styleNoLabel | styleCloud | styleNoRescale, Null, Null, Null, -1 );

bbm = (bbb + bbt) / 2; // middle bollingerbands
Plot( bbm , "BBMiddle" + _PARAM_VALUES(), colorBlack, styleDashed );

_SECTION_END();

_SECTION_BEGIN("Price");
SetChartOptions(0,chartShowArrows|chartShowDates);
_N(Title = StrFormat("{{NAME}} - {{INTERVAL}} {{DATE}} Open %g, Hi %g, Lo %g, Close %g (%.1f%%) {{VALUES}}", O, H, L, C, SelectedValue( ROC( C, 1 ) ) ));
Plot( C, "Close", ParamColor("Color", colorBlack ), styleNoTitle | ParamStyle("Style") | GetPriceStyle() );
_SECTION_END();


_SECTION_BEGIN("Fib Retracements");
	fibs = ParamToggle("Plot Fibs","Off|On",1);
	pctH = Param ("Pivot Hi %", 0.325,0.001,2.0,0.002);
	HiLB = Param ("Hi LookBack",1,1,BarCount-1,1);
	pctL = Param ("Pivot Lo %", 0.325,0.001,2.0,0.002);
	LoLB = Param ("Lo LookBack",1,1,BarCount-1,1);
	Back = Param ("Extend Left = 2",1,1,500,1);
	Fwd  = Param("Plot Forward", 0, 0, 500, 1);
	text = ParamToggle("Plot Text","Off|On",1);
	hts  = Param ("Text Shift", -33.5,-50,50,0.10);
	style =ParamStyle("Line Style",styleLine,styleNoLabel);
x = BarIndex();
pRp  = PeakBars( H, pctH, 1) == 0;
yRp0 = SelectedValue(ValueWhen( pRp, H, HiLB));
xRp0 = SelectedValue(ValueWhen( pRp, x, HiLB));
pSp  = TroughBars( L, pctL, 1) == 0;
ySp0 = SelectedValue(ValueWhen( pSp, L, LoLB));
xSp0 = SelectedValue(ValueWhen( pSp, x, LoLB));
Delta = yRp0 - ySp0;

function fib(ret)
{
retval = (Delta * ret);
Fibval = IIf(ret < 1.0
AND xSp0 < xRp0, yRp0 - retval, IIf(ret < 1.0
AND xSp0 > xRp0, ySp0 + retval,IIf(ret > 1.0
AND xSp0 < xRp0, yRp0 - retval, IIf(ret > 1.0
AND xSp0 > xRp0, ySp0 + retval, Null))));
return FibVal;
}

x0 = Min(xSp0,xRp0)-Back;
x1 = (BarCount -1);
//////////////////////////////////////////////////////////////////
r236 = fib(0.236);	r236I = LastValue (r236,1);
r382 = fib(0.382);	r382I = LastValue (r382,1);
r050 = fib(0.50);		r050I = LastValue (r050,1);
r618 = fib(0.618);	r618I = LastValue (r618,1);
r786 = fib(0.786);	r786I = LastValue (r786,1);
e127 = fib(1.27);		e127I = LastValue (e127,1);
e162 = fib(1.62);		e162I = LastValue (e162,1);
e200 = fib(2.00);		e200I = LastValue (e200,1);
e262 = fib(2.62);		e262I = LastValue (e262,1);
e424 = fib(4.24);		e424I = LastValue (e424,1);
//////////////////////////////////////////////////////////////////
p00 = IIf(xSp0 > xRp0,ySp0,yRp0); 	p00I = LastValue (p00,1);
p100 = IIf(xSp0 < xRp0,ySp0,yRp0); 	p100I = LastValue (p100,1);
color00 =IIf(xSp0 > xRp0,colorLime,colorRed);
color100 =IIf(xSp0 < xRp0,colorLime,colorRed);
//////////////////////////////////////////////////////////////////
numbars = LastValue(Cum(Status("barvisible")));
fraction= IIf(StrRight(Name(),3) == "", 3.2, 3.2);
//////////////////////////////////////////////////////////////////
if(fibs==1)
{
Plot(LineArray(xRp0-Fwd,yRp0,x1,yRp0,Back),"PR",32,8|styleNoRescale,Null, Null,Fwd);
Plot(LineArray(xSp0-Fwd,ySp0,x1,ySp0,Back),"PS",27,8|styleNoRescale,Null, Null,Fwd);
}

prev=AMA2(C,1,0);
d=IIf(C>Ref(Max(Max(H,Ref(H,-20)),Max(Ref(H,-10),Ref(H,-15))),-1),Min(Min(L,Ref(L,-20)),Min(Ref(L,-10),Ref(L,-15))),
  IIf(C<Ref(Min(Min(L,Ref(L,-20)),Min(Ref(L,-10),Ref(L,-15))),-1),Max(Max(H,Ref(H,-20)),Max(Ref(H,-10),Ref(H,-15))),PREV));
a=Cross(Close,d);
b=Cross(d,Close);
state=IIf(BarsSince(a)<BarsSince(b),1,0);
s=state>Ref(state,-1);
ss=state<Ref(state,-1);
sss=state==Ref(state,-1);
col=IIf(state == 1 ,51,IIf(state ==0,4,1));
Plot(C,"",Col,128);
PlotShapes( shapeUpArrow * s ,6,0,L);
PlotShapes( shapeDownArrow *ss ,4,0,H);
Buy=S;
Sell=SS;
Filter =  s OR sss OR sss  ;
AddColumn(C,"close",1.2);
AddColumn( IIf( s, 66,1 ), "buy", formatChar, 1, bkcolor =IIf (s,colorYellow, colorPink ));
AddColumn( IIf( Ss, 83,1 ), "sell", formatChar, 1, bkcolor =IIf (Ss,colorPink, colorYellow ));
AddColumn( IIf( sss, 87,1 ), "wait", formatChar, 1, bkcolor =IIf (sss,colorYellow, colorRed ));

_SECTION_BEGIN("");
_N(Title = "{{NAME}} - {{INTERVAL}} {{DATE}}: "+_DEFAULT_NAME()+" : {{OHLCX}} {{VALUES}}"
+"\n"+EncodeColor(colorBlack)+
WriteIf(s,"EXIT all Short positions\nif trading long positions, enter long Now-\nOR at the market price on tomorrow's Open with stop="+EncodeColor(4)+WriteVal(L+.75*ATR(5),1.4)+",","")+
WriteIf(ss,"exit all long positions today with a Market On Close (MOC) order\nOR at the market price on tomorrow's Open with stop="+EncodeColor(4)+WriteVal(Ref(H+.75*ATR(5), -1),1.4)+",","")+
WriteIf( sss ,"No trading signals today.","") );

/* Done      by    Rajandran R */
/* Author of www.marketcalls.in  */

// Paste the code below to your price //
//chart somewhere and green ribbon means//
//both MACD and ADX trending up so if //
//the red ribbon shows up the MACD and ///
//the ADX are both trending down.

_SECTION_BEGIN("trending ribbon");
uptrend=PDI()>MDI()AND Signal()<MACD();
downtrend=MDI()>PDI()AND Signal()>MACD();


Plot( 2, /* defines the height of the ribbon in percent of pane width
*/"ribbon",
IIf( uptrend, colorGreen, IIf( downtrend, colorRed, 0 )), /* choose color */
styleOwnScale|styleArea|styleNoLabel, -0.5, 100 );

_SECTION_END();
13 comments
Leave Comment
Please login here to leave a comment.
Its very good system with sup/res, that too with Fib logic. Since BB are real time indicator, its gives really nice signals for buy/sell. what about targets? Please help on this
Thanks
Viswanath
Yes, Mr Kv_Maligi .. i have added support and resistance with buy-sell arrows and ribbon to this system. Just track the buy/sell arrow with support resistance , u will get gr8 results.
i also added ATR to this system to give best results. Match the Ribbon colour with buy/sell arrows. If Ribbon is blue … Giving buy arrow… then go for the signal. If ribbon is red.. giving u sell arrow .. then Sell.
ITS GIVING ERROR
Unable to tun this AFL
Shall i use new version of Amibroker ? My Version is 5.20 RC1
I am unable to Run this AFL
Getting the attached errors ? Can some one please assist me.
Error#1
PlotOHLC( bbt, bbt, bbb, bbb, "",ColorBlend(
Error31,
Syntax error, expecting ‘)’ or ‘,’
-————————————————————-Error#2
return FibVal;
}
Error32.
Syntax error, Probably missing semicolon at the end of the previou line.
NO ERROR … AFL IS WORKING FINE IN AMIBROKER VERSION 5.50
HI anand!!
Can u please provide some free chart site..whereby i can use this formulas
Ravi, u can use the formula in Ambroker only. Not on any free chart site.
Hi
I am getting error on line 12
Ln:12 COL:45:error 31. syntax error, expecting’)‘or ’,’
kindly help
NO ERROR … AFL IS WORKING FINE IN AMIBROKER VERSION 5.50
Very useful!
Thank You
ya it is useful
Why is this useful when it “looks into the future”?