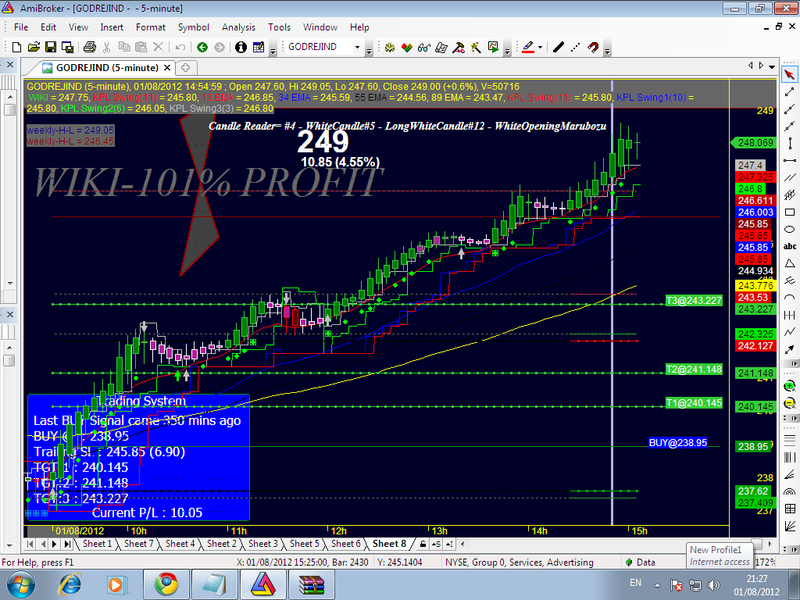
Book Profit with 101% garanty best modifiyed for Amibroker (AFL)
wiki almost 14 years ago Amibroker (AFL)
THIS AFL BE MODIFIYED SO TRED BE 101% GARANTY PROFIT AND REPLY PLz
download this and tred
http://www.mediafire.com/?znmwud2jdwt
Screenshots
Indicator / Formula
Copy & Paste Friendly
SetChartOptions(2,chartShowArrows|chartShowDates|chartWrapTitle);
SetChartOptions(0,chartShowArrows|chartShowDates);


//GfxGradientRect( 180, 30, 1759, 735, ColorRGB(40,40,40), ColorRGB(0,0,40) );
GfxSetOverlayMode(1);
GfxSelectPen( ColorRGB(150,0,0), 1 );
GfxSelectSolidBrush( ColorRGB(0,0,40) );
GfxRectangle( 0,750, 1807, 35 );

GfxSelectPen( ColorRGB(150,0,0), 2 );
GfxSelectSolidBrush( ColorRGB(65,65,65) );
GfxPolygon(250,200,200,250,250,20,200,50);

//GfxSelectPen( ColorRGB(125,0,0), 1 );
//GfxSelectSolidBrush( ColorRGB(0,0,40) );
//GfxRectangle( 10,100, 190, 160 );

GfxSelectPen( ColorRGB(0,0,0), 1 );
GfxSelectSolidBrush( ColorRGB(0,0,0) );
//GfxSetTextAlign( 250 );// center alignment

GfxSetOverlayMode(1);
GfxSelectFont("Times New Roman", 40, 400, True );
GfxSetTextColor( ColorRGB( 105, 105, 105 ) );
GfxSetBkMode(0); // transparent
GfxTextOut("WIKI-101% PROFIT", 10 , 100 );


_SECTION_BEGIN("Flower");
si=Param("Zoom/In Out",5,-50,100,1);
GraphXSpace=si;

r1 = Param( "ColorFast avg", 5, 2, 200, 1 );
r2 = Param( "ColorSlow avg", 10, 2, 200, 1 );
r3 = Param( "ColorSignal avg", 5, 2, 200, 1 );

m1=MACD(r1,r2);
s1=Signal(r1,r2,r3);
mycolor=IIf(m1<0 AND m1>s1, ColorRGB(155,155,155),IIf(m1>0 AND m1>s1,ColorRGB(0,125,0),IIf(m1>0 AND m1<s1,ColorRGB(180,30,160),ColorRGB(100,0,0))));

Prd1=Param("ATR Period",4,1,20,1);
Prd2=Param("Look Back",7,1,20,1);
green = HHV(LLV(L,Prd1)+ATR(Prd1),Prd2);
red = LLV(HHV(H,Prd1)-ATR(Prd1),Prd2);
flowerClose = EMA((Open+High+Low+Close)/4,3) ;
flowerOpen = EMA((Ref(Open,-1) + Ref(flowerClose,-1))/2,3);
Temp = Max(High, flowerOpen);
flowerHigh = EMA(Max(Temp, flowerClose),3);
Temp = Min(Low,flowerOpen);
flowerLow = EMA(Min(Temp, flowerClose),3);
barColor=IIf(Close>Open,ColorRGB(0,245,0),ColorRGB(255,0,0));

Ctmpl = E_TSKPCOLORTMPL(Open,High,Low,Close,Volume);
total = 0;
total = total  + IIf(tskp_colortmplcnd0 > 0, 1, -1);
total = total  + IIf(tskp_colortmplcnd1 > 0, 1, -1);
total = total  + IIf(tskp_colortmplcnd2 > 0, 1, -1);
total = total  + IIf(tskp_colortmplcnd3 > 0, 1, -1);
total = total  + IIf(tskp_colortmplcnd4 > 0, 1, -1);
total = total  + IIf(tskp_colortmplcnd5 > 0, 1, -1);
total = total  + IIf(tskp_colortmplcnd6 > 0, 1, -1);
total = total  + IIf(tskp_colortmplcnd7 > 0, 1, -1);
total = total  + IIf(tskp_colortmplcnd8 > 0, 1, -1);


for( i = 0; i < BarCount; i++ )
{

	if( total[i] >= 5 )
		Color[i] = colorLime;
	else if(  total[i] <= -5 )
		Color[i] = colorRed;
	else
		Color[i] = colorWhite;
}

Candle=ParamList("Candle","Modified Candlestick,WIKI,Normal Candlestick",1);
if(Candle=="Modified Candlestick")
{
ColorHighliter = myColor;
SetBarFillColor( ColorHighliter );
Plot (Close,"- Modified Candlestick", Color,ParamStyle( "Style", styleCandle|styleLine | styleThick, maskAll));
}
if(Candle=="WIKI")
{
ColorHighliter = myColor;
SetBarFillColor( ColorHighliter );
PlotOHLC( IIf(flowerOpen<flowerClose, flowerOpen, flowerClose),flowerHigh,flowerLow,IIf(flowerOpen<flowerClose, flowerClose, flowerOpen), "WIKI", Color, styleCandle|styleLine);
}
if(Candle=="Normal Candlestick")
{
//ColorHighliter = myColor;
//SetBarFillColor( ColorHighliter );
PlotOHLC(O,H,L,C,"Normal Candlestick",barcolor,styleCandle|styleLine);
}


_SECTION_END();


_SECTION_BEGIN("Resistance");
supres=ParamToggle("Sup_Res","No|Yes",1);
if(supres)
{

Prd1=Param("Res_Period1",2,0,200,1);

test   = TEMA  ( High , Prd1 ) ;

PK = test > Ref(test,-1) AND Ref(test,1) < High;//Peak
PKV0 = ValueWhen(PK,flowerHigh,0);//PeakValue0
PKV1 = ValueWhen(PK,flowerHigh,1);//PeakValue1
PKV2 = ValueWhen(PK,flowerHigh,2);//PeakValue2

MPK = PKV2 < PKV1 AND PKV1 > PKV0 ;//MajorPeak

RsColor=ParamColor("ResistColor",ColorRGB(225,0,0));
BrCount=Param("ResistBarLength",8,1,500,1);
for (i=0;i<BarCount-BrCount;i++) //hide the line except most recent 10 bars
{
	RsColor[i] = colorBlack;
}


MPKV = ValueWhen(Ref(MPK,-1) == 0 AND MPK == 1, PKV1,1); //MajorPeakValue
MPKD = ValueWhen(Ref(MPK,-1) == 0 AND MPK == 1, DateNum(),1); //MajorPeakDate
SD = IIf(DateNum() < LastValue(MPKD,lastmode = True ), Null, LastValue(MPKV,Lastmode = True));//SelectedDate
Plot(SD, "Resist1",  ColorRGB(200,0,0),ParamStyle("ResStyle1",styleDashed|styleNoTitle,maskAll));

RsColor2=ParamColor("Resist2Color",ColorRGB(225,0,0));
BrCount=Param("Resist2BarLength",8,1,500,1);
for (i=0;i<BarCount-BrCount;i++) //hide the line except most recent 10 bars
{
	RsColor2[i] = colorBlack;
}

MPKV2 = ValueWhen(Ref(MPK,-1) == 0 AND MPK == 1, PKV1,2); //MajorPeakValue
MPKD2 = ValueWhen(Ref(MPK,-1) == 0 AND MPK == 1, DateNum(),2); //MajorPeakDate
SD2 = IIf(DateNum() < LastValue(MPKD2,lastmode = True ), Null, LastValue(MPKV2,Lastmode = True));//SelectedDate
Plot(SD2, "Resist2", RsColor2,ParamStyle("ResStyle2",styleDashed|styleNoTitle,maskAll));

RsColor3=ParamColor("Resist3Color",ColorRGB(225,0,0));
BrCount=Param("Resist3BarLength",8,1,500,1);
for (i=0;i<BarCount-BrCount;i++) //hide the line except most recent 10 bars
{
	RsColor3[i] = colorBlack;
}


MPKV3 = ValueWhen(Ref(MPK,-1) == 0 AND MPK == 1, PKV1,3); //MajorPeakValue
MPKD3 = ValueWhen(Ref(MPK,-1) == 0 AND MPK == 1, DateNum(),3); //MajorPeakDate
SD3 = IIf(DateNum() < LastValue(MPKD3,lastmode = True ), Null, LastValue(MPKV3,Lastmode = True));//SelectedDate
Plot(SD3, "Resist3", RsColor3,ParamStyle("ResStyle3",styleThick|styleDots|styleNoTitle,maskAll));


_SECTION_END();


_SECTION_BEGIN("Support");

Prd2=Param("Sup_Period1",2,0,200,1);

test2   = TEMA ( Low , Prd2 ) ;

SP = Ref(test2,1) > Low AND test2 < Ref(test2,-1);//Peak
SPV0 = ValueWhen(SP,flowerLow,0);//PeakValue0
SPV1 = ValueWhen(SP,flowerLow,1);//PeakValue1
SPV2 = ValueWhen(SP,flowerLow,2);//PeakValue2

MSP = SPV2 > SPV1 AND SPV1 < SPV0 ;//MajorPeak

SpColor=ParamColor("SupColor",ColorRGB(0,225,0));
BrCount=Param("SupBarLength",8,1,500,1);
for (i=0;i<BarCount-BrCount;i++) //hide the line except most recent 10 bars
{
	SpColor[i] = colorBlack;
}


MSPV = ValueWhen(Ref(MSP,-1) == 0 AND MSP == 1, SPV1,1);
MSPD = ValueWhen(Ref(MSP,-1) == 0 AND MSP == 1, DateNum(),1);
SD = IIf(DateNum() < LastValue(MSPD,lastmode = True ), Null, LastValue(MSPV,Lastmode = True));
Plot(SD,"Support1",SpColor,ParamStyle("SupportLine1",styleDashed|styleNoTitle,maskAll));

SpColor2=ParamColor("SupColor2",ColorRGB(0,200,0));
BrCount=Param("Sup2BarLength",8,1,500,1);
for (i=0;i<BarCount-BrCount;i++) //hide the line except most recent 10 bars
{
	SpColor2[i] = colorBlack;
}


MSPV2 = ValueWhen(Ref(MSP,-1) == 0 AND MSP == 1, SPV1,2);
MSPD2 = ValueWhen(Ref(MSP,-1) == 0 AND MSP == 1, DateNum(),2);
SD2 = IIf(DateNum() < LastValue(MSPD2,lastmode = True ), Null, LastValue(MSPV2,Lastmode = True));
Plot(SD2,"Support2",Spcolor2,ParamStyle("SupportLine2",styleDashed|styleNoTitle,maskAll));

SpColor3=ParamColor("SupColor3",ColorRGB(0,175,0));
BrCount=Param("Sup3BarLength",8,1,500,1);
for (i=0;i<BarCount-BrCount;i++) //hide the line except most recent 10 bars
{
	SpColor3[i] = colorBlack;
}


MSPV3 = ValueWhen(Ref(MSP,-1) == 0 AND MSP == 1, SPV1,3);
MSPD3 = ValueWhen(Ref(MSP,-1) == 0 AND MSP == 1, DateNum(),3);
SD3 = IIf(DateNum() < LastValue(MSPD3,lastmode = True ), Null, LastValue(MSPV3,Lastmode = True));
Plot(SD3,"Support3",SpColor3,ParamStyle("SupportLine3",styleThick|styleDots|styleNoTitle,maskAll));
}
_SECTION_END();


_SECTION_BEGIN("TSKPPUSHDOTS");
if(Candle=="WIKI")
{
Combo = E_TSKPCOMBO(Open,High,Low,Close,Volume);
NewUpDown = E_TSKPNEWUPDOWN(Open,High,Low,Close,Volume);
UpDown7 = 0.5*(High+Low) - E_TSKPSTOPLINE(High,Low,Close);
//r=Param("Red",0,0,255,1);
//g=Param("Green",0,0,255,1);
//b=Param("Blue",0,0,255,1);

if(Candle=="Normal Candlestick" OR Candle=="Modified Candlestick")
{
PlotShapes( IIf( ((Combo>0) AND (NewUpDown > 0) AND (UpDown7 > 0)),shapeSmallCircle,shapeNone), ColorRGB(0,125,255),0, Low, -8);
PlotShapes( IIf( ((Combo<0) AND (NewUpDown < 0) AND (UpDown7 < 0)),shapeSmallCircle,shapeNone), ColorRGB(225,0,0),0, High, 8);
}

else
{
PlotShapes( IIf( ((Combo>0) AND (NewUpDown > 0) AND (UpDown7 > 0)),shapeSmallCircle,shapeNone), ColorRGB(0,255,0),0, flowerlow, -12);
PlotShapes( IIf( ((Combo<0) AND (NewUpDown < 0) AND (UpDown7 < 0)),shapeSmallCircle,shapeNone), ColorRGB(255,0,0),0, flowerhigh, 12);
}
}
_SECTION_END();

Title = StrFormat("\\c02 {{NAME}} | {{DATE}} | Open : %g | High : %g | Low : %g | Close : %g | Change = %.1f%% | Volume = " +WriteVal( V, 1.0 ) +", {{VALUES}}",
O, H, L, C, SelectedValue( ROC( C, 1 )) );


_SECTION_BEGIN("TSKPPIVOT");

if(Candle=="WIKI")
{
CHiPr = 0;
CLoPr = 9999999;
blsLong = 0;
PrevCOBar = 0;
NumBars = 0;
PrePP = 0;
PrevLowVal = 9999999;
BuySig = 0;
blsShort = 0;
PrevHiVal = 0;
blsNewCO = 0;
BarDif   = 0;

KPA900Val = E_TSKPA900(Close);
KPAutoStopVal = E_TSKPAUTOSTOP(High,Low,Close);

// -- Create 0-initialized arrays the size of barcount
aHPivs = flowerHigh - flowerHigh;
aLPivs = flowerLow - flowerLow;
aHiVal = flowerHigh - flowerHigh;
aLoVal = flowerLow - flowerLow;


Ctmpl = E_TSKPCOLORTMPL(Open,High,Low,Close,Volume);
sctotal = 0;
sctotal = sctotal  + IIf(tskp_colortmplcnd0 > 0, 1, -1);
sctotal = sctotal  + IIf(tskp_colortmplcnd1 > 0, 1, -1);
sctotal = sctotal  + IIf(tskp_colortmplcnd2 > 0, 1, -1);
sctotal = sctotal  + IIf(tskp_colortmplcnd3 > 0, 1, -1);
sctotal = sctotal  + IIf(tskp_colortmplcnd4 > 0, 1, -1);
sctotal = sctotal  + IIf(tskp_colortmplcnd5 > 0, 1, -1);
sctotal = sctotal  + IIf(tskp_colortmplcnd6 > 0, 1, -1);
sctotal = sctotal  + IIf(tskp_colortmplcnd7 > 0, 1, -1);
sctotal = sctotal  + IIf(tskp_colortmplcnd8 > 0, 1, -1);


for (curBar=0; curBar < BarCount-1; curBar++)
{

	if ( curBar == 0 )
	{
		CHiPr = flowerHigh[curBar];
		CHiBar = curBar;
		CLoPr = flowerLow[curBar];
		CLoBar = curBar;
		blsLong = 0;
		blsShort = 0;
		blsNewCO = 0;
		PrePP = 0;
		PrevCOBar = 0;
		PrevHiVal = flowerHigh[curBar];
		PrevLowVal = flowerLow[curBar];
		BuySig = 0;
		SellSig = 0;
		blsLL  = 0;
	}

	if (flowerHigh[CurBar] >= CHiPr) {
		CHiPr = flowerHigh[CurBar];
		ChiBar = CurBar;
	}

	if (flowerLow[CurBar] <= CLoPr) {
		CLoPr = flowerLow[CurBar];
		CLoBar = CurBar;
	}

	if ( (KPA900Val[curBar] >= KPAutoStopVal[curbar]) AND (PrePP != -1) AND (blsLong != 1) ){
		BarDif = CurBar - PrevCOBar;
		if (BarDif >= NumBars) {
			blsLong = 1;
			blsShort = 0;
			blsNewCO = 1;
			PrevCOBar = CurBar;
		}
	}

	if ( (KPA900Val[curBar] <= KPAutoStopVal[curbar]) AND (PrePP != 1) AND (blsShort != 1) ){
		BarDif = CurBar - PrevCOBar;
		if (BarDif >= NumBars) {
			blsLong = 0;
			blsShort = 1;
			blsNewCO = 1;
			PrevCOBar = CurBar;
		}
	}

	if ( (blsNewCO == 1) AND (sctotal[CurBar] >= 5) AND (blsLong == 1) ) {
		LVal = CurBar - CLoBar;
		for (j= CLoBar-1; j <= CLoBar+1; j++)
		{
			if (j >=0) {
				aLPivs[j] = 1;
				aLoVal[j] = CLoPr;
			}
		}
		PrePP = -1;
		blsNewCO = 0;
		CHiPr = flowerHigh[CurBar];
		CHiBar = CurBar;
		CLoPr = flowerLow[Curbar];
		CLoBar = CurBar;
		}
		else if ((blsNewCO == 1) AND (sctotal[CurBar] <= -5) AND (blsShort == 1) ) {
		HVal = CurBar - CHiBar;
		for (j= CHiBar-1; j <= CHiBar+1; j++)
		{
			if (j >=0) {
				aHPivs[j] = 1;
				aHiVal[j] = CHiPr;
			}
		}
		PrePP = 1;
		blsNewCO = 0;
		CHiPr = flowerHigh[CurBar];
		CHiBar = CurBar;
		CLoPr = flowerLow[Curbar];
		CLoBar = CurBar;
		}
}

PlotShapes(IIf(aHPivs == 1, 21,shapeNone), ColorRGB(255,0,145),0,   aHiVal,Offset = 20);
PlotShapes(IIf(aHPivs == 1, 15,shapeNone), ColorRGB(200,50,75),0,   aHiVal,Offset = 20);
PlotShapes(IIf(aLPivs == 1, 21,shapeNone), ColorRGB(0,125,225),0, aLoVal, Offset = -20);
PlotShapes(IIf(aLPivs == 1, 15,shapeNone), ColorRGB(0,125,255),0, aLoVal, Offset = -20);
}


_SECTION_END();


_SECTION_BEGIN("TSKPMoMo");

if(Candle=="WIKI")
{
blsLong = 0;
KPStopLine = E_TSKPSTOPLINE(High,Low,Close);
// tskp_upsell, tskp_triggerline, tskp_triggerlinevma
sw = E_TSKPUPSELL(Open,High,Low,Close,Volume);
KPTriggerLine = tskp_triggerline;
KPFast3Val = IIf((E_TSKPFAST3(Open,High,Low,Close,Volume)> 0),1, -1);
//tskp_fast2val1, tskp_fast2val2
dummy = E_TSKPFAST2(Open,High,Low,Close,Volume);
KPFast2Val = IIf ((tskp_fast2val1 > 0),1,-1);


Ctmpl = E_TSKPCOLORTMPL(Open,High,Low,Close,Volume);
sctotal = 0;
sctotal = sctotal  + IIf(tskp_colortmplcnd0 > 0, 1, -1);
sctotal = sctotal  + IIf(tskp_colortmplcnd1 > 0, 1, -1);
sctotal = sctotal  + IIf(tskp_colortmplcnd2 > 0, 1, -1);
sctotal = sctotal  + IIf(tskp_colortmplcnd3 > 0, 1, -1);
sctotal = sctotal  + IIf(tskp_colortmplcnd4 > 0, 1, -1);
sctotal = sctotal  + IIf(tskp_colortmplcnd5 > 0, 1, -1);
sctotal = sctotal  + IIf(tskp_colortmplcnd6 > 0, 1, -1);
sctotal = sctotal  + IIf(tskp_colortmplcnd7 > 0, 1, -1);
sctotal = sctotal  + IIf(tskp_colortmplcnd8 > 0, 1, -1);

// tskp_mediumma,tskp_mediumup,tskp_mediumdown
dummy = E_TSKPMEDIUM(Close);
KPMediumUP = tskp_mediumup;
KPMediumDwn = tskp_mediumdown;
KPMediumMA = tskp_mediumma;

// -- Create 0-initialized arrays the size of barcount
aHPivs = H - H;
aLPivs = L - L;
aHiVal = H - H;
aLoVal = L - L;


for (curBar=5; curBar < BarCount-1; curBar++)
{


	if( (blsLong == -1) OR (blsLong == 0))
	  {
       if ((sctotal[CurBar]  >= 5) AND (KPMediumUP[CurBar]  > KPMediumMA[CurBar] ) AND (KPFast3Val[CurBar]  == 1) AND
        (KPFast2Val[CurBar]  == 1) AND (KPTriggerLine[CurBar]  >= KPStopLine[CurBar] ))
       {
         blsLong = 1;
		  aLPivs[CurBar] = 1;
		  aLoVal[CurBar] = Low[CurBar];
       }
    }

	if( (blsLong == 1) OR (blsLong == 0))
	  {
       if ((sctotal[CurBar]  <= -5) AND (KPMediumDwn[CurBar]  < KPMediumMA[CurBar] ) AND (KPFast3Val[CurBar]  == -1) AND
       (KPFast2Val[CurBar]  == -1) AND (KPTriggerLine[CurBar]  <= KPStopLine[CurBar] ))
       {
         blsLong = -1;
         aHPivs[Curbar] = 1;
		  aHiVal[Curbar] = High[Curbar];
       }
    }

    if ((blsLong == 1) AND ((sctotal[CurBar]  < 5) OR (KPMediumUP[CurBar]  < KPMediumMA[CurBar] )  OR
       (KPFast2Val[CurBar]  < 1)  OR  (KPFast3Val[CurBar]  < 1) OR (KPTriggerLine[CurBar]  < KPStopLine[CurBar] )) )
       {
           blsLong= 0;
        }

      if ((blsLong == -1) AND ((sctotal[CurBar]  > -5)  OR  (KPMediumDwn[CurBar] > KPMediumMA[CurBar] )  OR
         (KPFast2Val[CurBar]  > -1)  OR (KPFast3Val[CurBar]  > -1)  OR
         (KPTriggerLine[CurBar]  > KPStopLine[CurBar] )) )
         {
            blsLong = 0;
         }
}

PlotShapes (IIf(aHPivs == 1, shapeHollowSmallSquare, shapeNone) ,colorRed, layer = 0, yposition = flowerHigh, offset = 12 );
PlotShapes (IIf(aLPivs == 1, shapeHollowSmallSquare, shapeNone) ,colorLime, layer = 0, yposition = flowerLow, offset = -12 );

}
_SECTION_END();


_SECTION_BEGIN("KPL Swing");
//Copyright Kamalesh Langote. Email:kpl@vfmdirect.com. More details at http://www.vfmdirect.com/kplswing
//Save indicator as "kplswing.afl" in C: program files > Amibroker > Formulas > Custom folder and then drap and drop on price chart
no=Param( "Swing", 11, 1, 55 );
tsl_col=ParamColor( "Color", colorCycle );

res=HHV(H,no);
sup=LLV(L,no);
avd=IIf(C>Ref(res,-1),1,IIf(C<Ref(sup,-1),-1,0));
avn=ValueWhen(avd!=0,avd,1);
tsl=IIf(avn==1,sup,res);

Plot(tsl, _DEFAULT_NAME(), tsl_col, styleStaircase); // or styleaArea

Buy=Cross(C,tsl);
Sell=Cross(tsl,C);
shape=Buy*shapeUpArrow + Sell*shapeDownArrow;
PlotShapes(shape,IIf(Buy,tsl_col,tsl_col),0,IIf(Buy,Low,High));
_SECTION_END();


///////////This system has kpl swing with ishimaku clouds and targets and stop loss

/////////////////////////////////// Programs Begins

//////////////////with near days high low scanner


////////////////////////////////////////////////////////////////////////////////////////////////


////////////////////////////////////////////////////////////////////////////////////////////


////////////////////////////////////////////////////////////////////////////////////////////
///////////////////////////////////////////////////////////////////////////////

messageboard = ParamToggle("Message Board","Show|Hide",0);
showsl = ParamToggle("Stop Loss Line", "Show|Hide", 0);
no=10;
res=HHV(H,no);
sup=LLV(L,no);
avd=IIf(C>Ref(res,-1),1,IIf(C<Ref(sup,-1),-1,0));
avn=ValueWhen(avd!=0,avd,1);
s5d=IIf(avn==1,sup,res);

if (showsl == 0)
//{Plot(s5d,"Stop Loss",colorCustom14,styleDots);}
exitlong = Cross(s5d, H);
PlotShapes(exitlong * shapeNone, colorBlack,0,H,-10);
exitshort = Cross(L, s5d);
PlotShapes(exitshort * shapeNone, colorBlack,0,L,-15);

Buy = exitshort;
Sell = exitlong;
//Short = Sell;
//Cover = Buy;
Buy = ExRem(Buy,Sell);
Sell = ExRem(Sell,Buy);
//Short = ExRem(Short, Cover);
//Cover = ExRem(Cover, Short);
AlertIf( Buy, "", "BUY @ " + C, 1 );
AlertIf( Sell, "", "SELL @ " + C, 2 );

for(i=BarCount-1;i>1;i--)
{
if(Buy[i] == 1)
{
entry = C[i];
sig = "BUY";
sl = s5d[i];
tar1 = entry + (entry * .0050);
tar2 = entry + (entry * .0092);
tar3 = entry + (entry * .0179);

bars = i;
i = 0;
}
if(Sell[i] == 1)
{
sig = "SELL";
entry = C[i];
sl = s5d[i];
tar1 = entry - (entry * .0050);
tar2 = entry - (entry * .0112);
tar3 = entry - (entry * .0212);


bars = i;
i = 0;
}
}
Offset = 20;
Clr = IIf(sig == "BUY", colorLime, colorRed);
ssl = IIf(bars == BarCount-1, s5d[BarCount-1], Ref(s5d, -1));
sl = ssl[BarCount-1];

Plot(LineArray(bars-Offset, tar1, BarCount, tar1,1), "", Clr, styleLine|styleDots, Null, Null, Offset);
Plot(LineArray(bars-Offset, tar2, BarCount, tar2,1), "", Clr, styleLine|styleDots, Null, Null, Offset);
Plot(LineArray(bars-Offset, tar3, BarCount, tar3,1), "", Clr, styleLine|styleDots, Null, Null, Offset);

Plot(LineArray(bars-Offset, sl, BarCount, sl,1), "", colorDarkRed, styleLine|styleLine, Null, Null, Offset);
Plot(LineArray(bars-Offset, entry, BarCount, entry,1), "", colorGreen, styleLine|styleLine, Null, Null, Offset);

for (i=bars; i <BarCount;i++)
{
PlotText(""+sig+"@"+entry, BarCount+1,entry,Null,colorBlue);
PlotText("T1@"+tar1,BarCount+3,tar1,Null,Clr);PlotText("T2@"+tar2,BarCount+3,tar2,Null,Clr);PlotText ("T3@"+tar3,BarCount+3,tar3,Null,Clr);

}


printf("Last " + sig + " Signal came " + (BarCount-bars) + " bars ago");
printf("\n" + sig + " @ : " + entry + "\nStop Loss : " + sl + " (" + WriteVal(IIf(sig == "SELL",entry-sl,sl-entry), 2.2) + ")"+ "\nTarget_1 : " + tar1 + "\nTarget_2 : " + tar2 + "\nTarget_3 : " + tar3);
printf("\nCurrent P/L : " + WriteVal(IIf(sig == "BUY",(C-entry),(entry-C)),2.2));

if (messageboard == 0 )
{
GfxSelectFont( "Tahoma", 13, 100 );
GfxSetBkMode( 1 );
GfxSetTextColor( colorWhite );

if ( sig =="BUY")
{
GfxSelectSolidBrush( colorBlue ); // this is the box background color
}
else
{
GfxSelectSolidBrush( colorRed ); // this is the box background color
}
pxHeight = Status( "pxchartheight" ) ;
xx = Status( "pxchartwidth");
Left = 1100;
width = 310;
x = 5;
x2 = 290;

y = pxHeight;

GfxSelectPen( colorGreen, 1); // broader color
GfxRoundRect( x, y - 163, x2, y , 5, 7 ) ;
GfxTextOut( ( " Trading System "),88,y-165);
GfxTextOut( (" "),27,y-160);
GfxTextOut( ("Last " + sig + " Signal came " + (BarCount-bars-1) * Interval()/60 + " mins ago"), 13, y-140) ; // The text format location
GfxTextOut( ("" + WriteIf(sig =="BUY",sig + " @ ",sig + " @") + " : " + entry), 13, y-120);
GfxTextOut( ("Trailing SL : " + sl + " (" + WriteVal(IIf(sig == "SELL",entry-sl,sl-entry), 2.2) + ")"), 13, y-100);
GfxTextOut( ("TGT:1 : " + tar1), 13, y -80);
GfxTextOut( ("TGT:2 : " + tar2), 13,y-60);
GfxTextOut( ("TGT:3 : " + tar3), 13,y-40);
GfxTextOut( ("Current P/L : " + WriteVal(IIf(sig == "BUY",(C-entry),(entry-C)),2.2)), 88, y-22);;

}
//////////////////////////////////////////////////////////////////////////////////////////////////////////


//////////////////////////////////////////////////////////////////////////////////////////////////////////

_SECTION_BEGIN("Magnified Market Price");
FS=Param("Font Size",30,30,100,1);
GfxSelectFont("Arial", FS, 700, italic = False, underline = False, True );
GfxSetBkMode( colorWhite );
GfxSetTextColor( ParamColor("Color",colorWhite) );
Hor=Param("Horizontal Position",350,800,800,800);
Ver=Param("Vertical Position",50,27,27,27);
GfxTextOut(""+C,Hor , Ver );
YC=TimeFrameGetPrice("C",inDaily,-1);
DD=Prec(C-YC,2);
xx=Prec((DD/YC)*100,2);
GfxSelectFont("Arial", 12, 700, italic = False, underline = False, True );
GfxSetBkMode( colorWhite );
GfxSetTextColor(ParamColor("Color",colorYellow) );
GfxTextOut(""+DD+" ("+xx+"%)", Hor+5, Ver+45 );
_SECTION_END();

////////////////////////////////////////////////////////////////////////////////


/////////////////////////////////////////////////////////////////////////////////////


/*Plot EMA*/
Plot( EMA( Close,13), "13 EMA", colorRed,styleLine);
Plot( EMA( Close,34), "34 EMA", colorBlue,styleLine);
Plot( EMA( Close,55), "55 EMA", colorBlack,styleLine);
Plot( EMA( Close,89), "89 EMA", colorYellow,styleLine);


/////////////////////////////////////Kpl Swing
//////////////////////////////////////////////////////////////////////////////////////////////////////////////////////////////////////////////////////////
//kpl swing formula here
//---- heikin ashi
HaClose = (O+H+L+C)/4;
HaOpen = AMA( Ref( HaClose, -1 ), .40);
HaHigh = Max( H, Max( HaClose, HaOpen ) );
HaLow = Min( L, Min( HaClose, HaOpen ) );
xDiff = (HaHigh - Halow) * IIf(StrFind(Name(),"JPY"),100,10000);
// Plot(EMA(HaClose,9),"",colorWhite, styleLine);
// Plot(EMA(HaClose,18),"",colorBlack, styleLine);
_SECTION_BEGIN("KPL Swing");
no=Param( "Swing", 10, 1, 55 );
tsl_col=ParamColor( "Color", colorCycle );

res=HHV(H,no);
sup=LLV(L,no);
avd=IIf(C>Ref(res,-1),1,IIf(C<Ref(sup,-1),-1,0));
avn=ValueWhen(avd!=0,avd,1);
tsl=IIf(avn==1,sup,res);

Plot(tsl, _DEFAULT_NAME(), tsl_col, styleStaircase); // or styleaArea

_SECTION_END();


////////////////////details of stock at the title

_SECTION_BEGIN("Price");
SetChartOptions(0,chartShowArrows|chartShowDates);
_N(Title = StrFormat("{{NAME}} - {{INTERVAL}} {{DATE}} Open %g, Hi %g, Lo %g, Close %g (%.1f%%) {{VALUES}}", O, H, L, C, SelectedValue( ROC( C, 1 ) ) ));

_SECTION_END();


/////////////////////weekly high low

_SECTION_BEGIN("weekly-H-L");
Hclose=HHV(H,5);
Lclose= LLV(L,5);
DH = EncodeColor(colorDarkBlue) + "weekly-H-L = " + Hclose + "\n";
DL = EncodeColor(colorDarkRed) + "weekly-H-L = " + Lclose + "\n";
_N(Title = StrFormat("{{NAME}} ({{INTERVAL}}), {{DATE}} ; {{OHLCX}}, V=%1.0f\n {{VALUES}}\n\n", V) + DH + DL);

_SECTION_END();

/////////////////Stock near days high and low scanner
TimeFrameSet(inHourly);
H1 = HHV(H, 1) ;

H2= (H1-C)< .001*C;

L1 = LLV(L,1) ;


L2 = (C-L1) < .001*C ;

TimeFrameRestore() ;

SetOption("NoDefaultColumns", True);

AddTextColumn(Name(), "Symbol");
AddColumn(DateTime(), "Date", formatDateTime);
AddColumn(C, "CMP", 1.2);


Filter = H2 OR L2 ;

Buy = H2 ;
Sell = L2 ;


///////////////////////////candle stick reader


_SECTION_BEGIN("Candle Identification");
O1 = Ref(O,-1);O2 = Ref(O,-2);
H1 = Ref(H,-1);H2 = Ref(H,-2);
L1 = Ref(L,-1);L2 = Ref(L,-2);
C1 = Ref(C,-1);C2 = Ref(C,-2);
function CandlePattern(P)
   {
   global PatternName;
   if(P == 0) { PatternName = "NearDoji"; Pv = (abs(O-C)<= ((H-L)*0.1)); }
   else if(P == 1) { PatternName = "BlackCandle"; Pv = (O>C); }
   else if(P == 2) { PatternName = "LongBlackCandle"; Pv = (O>C AND
(O-C)/(.001+H-L)>.6); }
   else if(P == 3) { PatternName = "SmallBlackCandle"; Pv = ((O>C) AND
((H-L)>(3*(O-C)))); }
   else if(P == 4) { PatternName = "WhiteCandle"; Pv = (C>O); }
   else if(P == 5) { PatternName = "LongWhiteCandle"; Pv = ((C>O) AND
((C-O)/(.001+H-L)>.6)); }
   else if(P == 6) { PatternName = "SmallWhiteCandle"; Pv = ((C>O) AND
((H-L)>(3*(C-O)))); }
   else if(P == 7) { PatternName = "BlackMaubozu"; Pv = (O>C AND H==O AND
C==L); }
   else if(P == 8) { PatternName = "WhiteMaubozu"; Pv = (C>O AND H==C AND
O==L); }
   else if(P == 9) { PatternName = "BlackClosingMarubozu"; Pv = (O>C AND
C==L); }
   else if(P == 10) { PatternName = "WhiteClosingMarubozu"; Pv = (C>O AND
C==H); }
   else if(P == 11) { PatternName = "BlackOpeningMarubozu"; Pv = (O>C AND
O==H); }
   else if(P == 12) { PatternName = "WhiteOpeningMarubozu"; Pv = (C>O AND
O==L); }
   else if(P == 13) { PatternName = "HangingMan"; Pv = (((H-L)>4*(O-C)) AND
((C-L)/(.001+H-L)>= 0.75) AND ((O-L)/(.001+H-L)>= 0.75)); }
   else if(P == 14) { PatternName = "Hammer"; Pv = (((H-L)>3*(O-C)) AND
((C-L)/(.001+H-L)>0.6) AND ((O-L)/(.001+H-L)>0.6)); }
   else if(P == 15) { PatternName = "InvertedHammer"; Pv = (((H-L)>3*(O-C))
AND ((H-C)/(.001+H-L)>0.6) AND ((H-O)/(.001+H-L)>0.6)); }
   else if(P == 16) { PatternName = "ShootingStar"; Pv = (((H-L)>4*(O-C))
AND ((H-C)/(.001+H-L)>= 0.75) AND ((H-O)/(.001+H-L)>= 0.75)); }
   else if(P == 17) { PatternName = "BlackSpinningTop"; Pv = ((O>C) AND
((H-L)>(3*(O-C))) AND (((H-O)/(.001+H-L))<.4) AND
(((C-L)/(.001+H-L))<.4)); }
   else if(P == 18) { PatternName = "WhiteSpinningTop"; Pv = ((C>O) AND
((H-L)>(3*(C-O))) AND (((H-C)/(.001+H-L))<.4) AND
(((O-L)/(.001+H-L))<.4)); }
   else if(P == 19) { PatternName = "BearishAbandonedBaby"; Pv = ((C1 == O1)
AND (C2>O2) AND (O>C) AND (L1>H2) AND (L1>H)); }
   else if(P == 20) { PatternName = "BearishEveningDojiStar"; Pv = ((C2>O2)
AND ((C2-O2)/(.001+H2-L2)>.6) AND (C2<O1) AND (C1>O1) AND
((H1-L1)>(3*(C1-O1))) AND (O>C) AND (O<O1)); }
   else if(P == 21) { PatternName = "DarkCloudCover"; Pv = (C1>O1 AND
((C1+O1)/2)>C AND O>C AND O>C1 AND C>O1 AND (O-C)/(.001+(H-L)>0.6)); }
   else if(P == 22) { PatternName = "BearishEngulfing"; Pv = ((C1>O1) AND
(O>C) AND (O>= C1) AND (O1>= C) AND ((O-C)>(C1-O1))); }
   else if(P == 23) { PatternName = "ThreeOutsideDownPattern"; Pv = ((C2>O2)
AND (O1>C1) AND (O1>= C2) AND (O2>= C1) AND ((O1-C1)>(C2-O2)) AND (O>C) AND
(C<C1)); }
   else if(P == 24) { PatternName = "BullishAbandonedBaby"; Pv = ((C1 == O1)
AND (O2>C2) AND (C>O) AND (L2>H1) AND (L>H1)); }
   else if(P == 25) { PatternName = "BullishMorningDojiStar"; Pv = ((O2>C2)
AND ((O2-C2)/(.001+H2-L2)>.6) AND (C2>O1) AND (O1>C1) AND
((H1-L1)>(3*(C1-O1))) AND (C>O) AND (O>O1)); }
   else if(P == 26) { PatternName = "BullishEngulfing"; Pv = ((O1>C1) AND
(C>O) AND (C>= O1) AND (C1>= O) AND ((C-O)>(O1-C1))); }
   else if(P == 27) { PatternName = "ThreeOutsideUpPattern"; Pv = ((O2>C2)
AND (C1>O1) AND (C1>= O2) AND (C2>= O1) AND ((C1-O1)>(O2-C2)) AND (C>O) AND
(C>C1)); }
   else if(P == 28) { PatternName = "BullishHarami"; Pv = ((O1>C1) AND (C>O)
AND (C<= O1) AND (C1<= O) AND ((C-O)<(O1-C1))); }
   else if(P == 29) { PatternName = "ThreeInsideUpPattern"; Pv = ((O2>C2)
AND (C1>O1) AND (C1<= O2) AND (C2<= O1) AND ((C1-O1)<(O2-C2)) AND (C>O) AND
(C>C1) AND (O>O1)); }
   else if(P == 30) { PatternName = "PiercingLine"; Pv = ((C1<O1) AND
(((O1+C1)/2)<C) AND (O<C) AND (O<C1) AND (C<O1) AND
((C-O)/(.001+(H-L))>0.6)); }
   else if(P == 31) { PatternName = "BearishHarami"; Pv = ((C1>O1) AND (O>C)
AND (O<= C1) AND (O1<= C) AND ((O-C)<(C1-O1))); }
   else if(P == 32) { PatternName = "ThreeInsideDownPattern"; Pv = ((C2>O2)
AND (O1>C1) AND (O1<= C2) AND (O2<= C1) AND ((O1-C1)<(C2-O2)) AND (O>C) AND
(C<C1) AND (O<O1)); }
   else if(P == 33) { PatternName = "ThreeWhiteSoldiers"; Pv = (C>O*1.01)
AND (C1>O1*1.01) AND (C2>O2*1.01) AND (C>C1) AND (C1>C2) AND (O<C1) AND
(O>O1) AND (O1<C2) AND (O1>O2) AND (((H-C)/(H-L))<.2) AND
(((H1-C1)/(H1-L1))<.2) AND (((H2-C2)/(H2-L2))<.2); }
   else if(P == 34) { PatternName = "DarkCloudCover"; Pv = (C1>O1*1.01) AND
(O>C) AND (O>H1) AND (C>O1) AND (((C1+O1)/2)>C) AND (C>O1) AND
(MA(C,13)-Ref(MA(C,13),-4)>0); }
   else if(P == 35) { PatternName = "ThreeBlackCrows"; Pv = (O>C*1.01) AND
(O1>C1*1.01) AND (O2>C2*1.01) AND (C<C1) AND (C1<C2) AND (O>C1) AND (O<O1)
AND (O1>C2) AND (O1<O2) AND (((C-L)/(H-L))<.2) AND (((C1-L1)/(H1-L1))<.2)
AND (((C2-L2)/(H2-L2))<.2); }
   else if(P == 36) { PatternName = "doji"; Pv = (O == C); }
   else if(P == 37) { PatternName = "GapUp"; Pv = GapUp(); }
   else if(P == 38) { PatternName = "GapDown"; Pv = GapDown(); }
   else if(P == 39) { PatternName = "BigGapUp"; Pv = L>1.01*H1; }
   else if(P == 40) { PatternName = "BigGapDown"; Pv = H<0.99*L1; }
   else if(P == 41) { PatternName = "HugeGapUp"; Pv = L>1.02*H1; }
   else if(P == 42) { PatternName = "HugeGapDown"; Pv = H<0.98*L1; }
   else if(P == 43) { PatternName = "DoubleGapUp"; Pv = GapUp() AND
Ref(GapUp(),-1); }
   else if(P == 44) { PatternName = "DoubleGapDown"; Pv = GapDown() AND
Ref(GapDown(),-1); }
   return Pv;
   }

PatternNameList = "";
for(Cp=0; Cp<=44; Cp++)
	{
	VarSet("Pattern"+NumToStr(Cp,1.0),CandlePattern(cP));
	PatternNameList = PatternNameList +PatternName+",";
	}

BI = BarIndex();
SelectedBar = SelectedValue(BI) -BI[0];
//Selectedbar = Status("lastvisiblebar")-1;
PStr="";
for(Cp=0; Cp<=44; Cp++)
	{
	Temp = VarGet("Pattern"+NumToStr(Cp,1.0));
	if(temp[SelectedBar]) Pstr=Pstr+"#"+NumToStr(Cp,1.0)+" - "+StrExtract(PatternNameList,Cp)+"\n";
	}


FS=Param("Font Size",11,11,100,1);
GfxSelectFont("Times New Roman", FS, 700, True );
GfxSetBkMode( colorWhite );
GfxSetTextColor( ParamColor("Color",colorWhite) );
Hor=Param("Horizontal Position",237,1,1200,1);
Ver=Param("Vertical Position",50,1,830,1);
GfxTextOut("Candle Reader= "+Pstr, Hor , Ver );


_SECTION_END();

_SECTION_BEGIN("KPL Swing1");
//Copyright Kamalesh Langote. Email:kpl@vfmdirect.com. More details at http://www.vfmdirect.com/kplswing
//Save indicator as "kplswing.afl" in C: program files > Amibroker > Formulas > Custom folder and then drap and drop on price chart
no=Param( "Swing", 10, 1, 55 );
tsl_col=ParamColor( "Color", colorCycle );

res=HHV(H,no);
sup=LLV(L,no);
avd=IIf(C>Ref(res,-1),1,IIf(C<Ref(sup,-1),-1,0));
avn=ValueWhen(avd!=0,avd,1);
tsl=IIf(avn==1,sup,res);

Plot(tsl, _DEFAULT_NAME(), tsl_col, styleStaircase); // or styleaArea

Buy=Cross(C,tsl);
Sell=Cross(tsl,C);
shape=Buy*shapeUpArrow + Sell*shapeDownArrow;
PlotShapes(shape,IIf(Buy,tsl_col,tsl_col),0,IIf(Buy,Low,High));
_SECTION_END();

_SECTION_BEGIN("KPL Swing2");
//Copyright Kamalesh Langote. Email:kpl@vfmdirect.com. More details at http://www.vfmdirect.com/kplswing
//Save indicator as "kplswing.afl" in C: program files > Amibroker > Formulas > Custom folder and then drap and drop on price chart
no=Param( "Swing", 6, 1, 55 );
tsl_col=ParamColor( "Color", colorCycle );

res=HHV(H,no);
sup=LLV(L,no);
avd=IIf(C>Ref(res,-1),1,IIf(C<Ref(sup,-1),-1,0));
avn=ValueWhen(avd!=0,avd,1);
tsl=IIf(avn==1,sup,res);

Plot(tsl, _DEFAULT_NAME(), tsl_col, styleStaircase); // or styleaArea

Buy=Cross(C,tsl);
Sell=Cross(tsl,C);
shape=Buy*shapeUpArrow + Sell*shapeDownArrow;
PlotShapes(shape,IIf(Buy,tsl_col,tsl_col),0,IIf(Buy,Low,High));
_SECTION_END();

_SECTION_BEGIN("KPL Swing3");
//Copyright Kamalesh Langote. Email:kpl@vfmdirect.com. More details at http://www.vfmdirect.com/kplswing
//Save indicator as "kplswing.afl" in C: program files > Amibroker > Formulas > Custom folder and then drap and drop on price chart
no=Param( "Swing", 3, 1, 55 );
tsl_col=ParamColor( "Color", colorCycle );

res=HHV(H,no);
sup=LLV(L,no);
avd=IIf(C>Ref(res,-1),1,IIf(C<Ref(sup,-1),-1,0));
avn=ValueWhen(avd!=0,avd,1);
tsl=IIf(avn==1,sup,res);

Plot(tsl, _DEFAULT_NAME(), tsl_col, styleStaircase); // or styleaArea

Buy=Cross(C,tsl);
Sell=Cross(tsl,C);
shape=Buy*shapeUpArrow + Sell*shapeDownArrow;
PlotShapes(shape,IIf(Buy,tsl_col,tsl_col),0,IIf(Buy,Low,High));
_SECTION_END();
9 comments
Leave Comment
Please login here to leave a comment.
Lot of errors. Please post corrected afl file
Please let me know how to trade using this indicator?
Afl not working. Too many errors. Pl. let me know on which version it will work. Post corrected afl
plz use latest version it is work super i will next modifide version be on positive work then u have take only profit not loss B+++++ be positive frd dont worry i give u targe for book profit u must take profit and more like u as well as u take profit like u just susing arrow work like white arrow show u take profit befor loss and wornig u to exit so this afl only make profit not loss dont take loss only profit dear
how i can down load this afl
there are so many errors in this afl
Thanks a lot, it looks really great and I love that it does not use future references at all, still gives very good signals.
many errors with Ami 5.5 and 5.6 versions Wiki dear
sir any latest afl software.