ProTrader v1.0 for Amibroker (AFL)
Anonymous almost 14 years ago Amibroker (AFL)
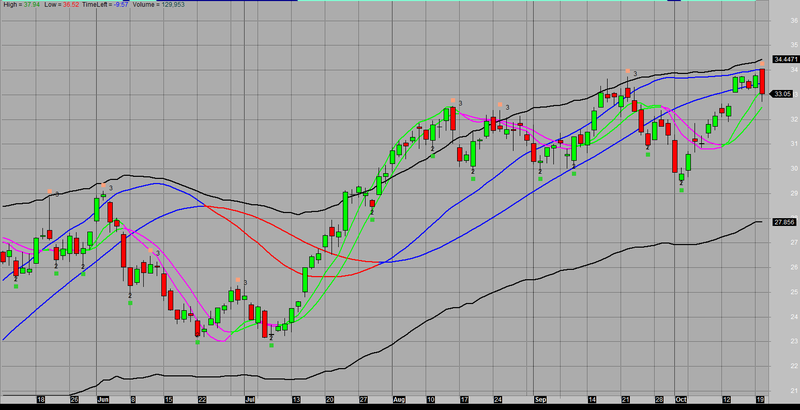
ProTrader, with Fibo retracements and Extensions.
Added also Pivot-Market-Structure-Points 2 and 3’s.
Keep trading in the direction off the Mid-Band and the Large Triggers.
Small Triggers are your starting setups in the direction of the trend!
Works execellent with the BB-MACD.
Screenshots
Indicator / Formula
Copy & Paste Friendly
_SECTION_BEGIN("Price");
SetChartOptions(0,chartShowArrows|chartShowDates);
SetBarFillColor(IIf(C>O,ParamColor("Candle Up Color",colorBrightGreen),IIf(C<=O,ParamColor("Candle Down Color",colorRed),colorLightGrey)));//Up=Lime/Down=Red
Plot(C,"Price",IIf(C>O,ParamColor("Shadow Up Color",colorBlack),IIf(C<=O,ParamColor("Shadow Down Color",colorBlack),colorLightGrey)),64,0,0,0,0);//Up=DarkGreen/Down=DarkRed/64=Candle/128=Bar
SetChartBkColor(ParamColor("Panel Color",colorLightGrey));
SetChartBkGradientFill(ParamColor("Upper Chart",ColorRGB( 172,172,172 )),ParamColor("Lower Chart",ColorRGB( 172,172,172 )));
dec=(Param("Decimals",2,0,7,1)/10)+1;
GraphXSpace=Param("GraphXSpace",20,-10,25,1);

Disp1=ParamToggle("Horizontal PriceLine","Show|Hide",0);
if(Disp1){
PriceLineColor= colorPaleBlue;
PriceLevel=C;
Daysback= 100;
FirstBar= BarCount - DaysBack;
YY= IIf(BarIndex() >= Firstbar,EndValue(PriceLevel),Null);
Plot(YY,"Current Price",PriceLineColor,styleLine|styleDashed|styleNoTitle|styleNoLabel,maskAll);
Side=1;
Dist=0;
for(i = 0; i < BarCount; i++ )
{
if(i+Side== BarCount) PlotText("\n    " + PriceLevel[ i ], i, YY[ i ]-Dist[i], colorBlack );
}}

BarTime1=LastValue(TimeNum() - Now(4));
DataError=IIf(Now(4) > TimeNum(),True,False);
TimeBase=IIf(Interval(1)>0,1,0);
_N(StrBarTime=NumToStr(BarTime1,1.0,False));
BT_Length=StrLen(StrBarTime);
_N(TimeLeft_=
WriteIf(BT_Length==1,"0:0"+StrBarTime,WriteIf(BT_Length==2,"0:"+StrBarTime,
WriteIf(BT_Length==3,StrLeft(StrBarTime,1)+":"+StrRight(StrBarTime,2),
StrLeft(StrBarTime,2)+":"+StrRight(StrBarTime,2)))));
TimeLeft=WriteIf(TimeBase==1,TimeLeft_,"N/A");
Title= EncodeColor(16)+ " High = "+ EncodeColor(27) + WriteVal(H,dec) +
EncodeColor(16)+ "   Low = "+ EncodeColor(32)+ WriteVal(L,dec) +
EncodeColor(16) +"  TimeLeft = "+ EncodeColor(29) +TimeLeft  +
EncodeColor(16)+ "   Volume = "+ EncodeColor(18)+ WriteVal(V,1);
_SECTION_END();

_SECTION_BEGIN("GFX EMA");
procedure Plotlinewidth(pvalue,ptitle,pcolor,pstyle,pmin,pmax,pxshift,plinewidth,pshowdate)
{
local pvalue,ptitle,pcolor,pstyle,pmin,pmax,pxshift,plinewidth,ppenstyle,pshowdate;
local Miny,Maxy; local Lvb,fvb; local pxwidth,pxheight; local TotalBars,axisarea; local i,x,y;
if(plinewidth>0 && Status("action") == 1 && (pstyle & styleLine==styleLine)){
GfxSetOverlayMode(0);
Miny=Status("axisminy"); Maxy=Status("axismaxy");
lvb=Status("lastvisiblebar"); fvb=Status("firstvisiblebar");
pxwidth=Status("pxwidth"); pxheight=Status("pxheight");
TotalBars=Lvb-fvb; xaxisarea=56;
if(pshowdate)yaxisarea=10;
else
yaxisarea=0; i=0;
x=5+i*(pxwidth-xaxisarea-10)/( TotalBars+1);
y=5+yaxisarea+(pvalue[i+fvb]-Miny)*(pxheight-yaxisarea-10)/(Maxy-Miny);
GfxMoveTo(x,pxheight - y);
for(i=1; i<TotalBars AND i<(BarCount-fvb); i++)
{
GfxSelectPen(pcolor[i + fvb],plinewidth,0);
x=5+i*(pxwidth-xaxisarea-10)/(TotalBars+1);
y=5+yaxisarea+(pvalue[i+fvb]-Miny)*(pxheight-yaxisarea-10)/(Maxy-Miny);
GfxLineTo(x,pxheight - y);
}}}
RequestTimedRefresh(2);
_SECTION_END();

_SECTION_BEGIN("Trend Bands");
Linewidth_ma=Param("Thickness MidBand",3,0,10,1);
showdate=1;
P = ParamField("Price field",-1);
Periods = Param("Periods", 28, 2, 300, 1 );
Width = Param("Width2", 3.50, 0, 10, 0.05 );
MidBand=Wilders(P, Periods);
Plotlinewidth(MidBand,"MidBand",IIf(C>MidBand,colorAqua,colorDarkBlue),styleLine,Null,Null,0,Linewidth_ma,showdate);
Upperband=Midband+Width * ATR( Periods );
Lowerband=Midband-Width * ATR( Periods );
Plot( Upperband, "Upperband" , colorBlack, styleThick | styleNoRescale );
Plot( Lowerband, "Lowerband" , colorBlack, styleThick | styleNoRescale );
_SECTION_END();

_SECTION_BEGIN("Small Triggers");
p1 = Param("TL 1 Periods", 20, 5, 50, 1);
p2 = Param("TL 2 Periods", 5, 3, 25, 1);
TL1 = LinearReg(C, p1);
TL2 = EMA(TL1, p2);
Col1 = IIf(TL1 > TL2, ParamColor("TL Up Colour", colorBrightGreen), ParamColor("TL Dn Colour", colorCustom12));
Plot(TL1, "TriggerLine 1", Col1, styleLine|styleThick|styleNoLabel);
Plot(TL2, "TriggerLine 2", Col1, styleLine|styleThick|styleNoLabel);
_SECTION_END();

_SECTION_BEGIN("Large Triggers");
p3 = Param("TL 3 Periods", 80, 5, 100, 1);
p4 = Param("TL 4 Periods", 20, 3, 100, 1);
TL3 = LinearReg(C, p3);
TL4 = EMA(TL3, p4);
Col1 = IIf(TL3 > TL4, ParamColor("TLL Up Colour", colorBlue), ParamColor("TLL Dn Colour", colorRed));
Plot(TL3, "TriggerLine 3", Col1, styleLine|styleThick|styleNoLabel);
Plot(TL4, "TriggerLine 4", Col1, styleLine|styleThick|styleNoLabel);
_SECTION_END();

_SECTION_BEGIN("Fibo Retrace and Extensions");
	fibs = ParamToggle("Plot Fibs","Off|On",1);
	pctH = Param ("Pivot Hi %", 0.325,0.001,2.0,0.002);
	HiLB = Param ("Hi LookBack",1,1,BarCount-1,1);
	pctL = Param ("Pivot Lo %", 0.325,0.001,2.0,0.002);
	LoLB = Param ("Lo LookBack",1,1,BarCount-1,1);
	Back = Param ("Extend Left = 2",1,1,500,1);
	Fwd  = Param("Plot Forward", 0, 0, 500, 1);
	text = ParamToggle("Plot Text","Off|On",1);
	hts  = Param ("Text Shift", -33.5,-50,50,0.10);
	style =ParamStyle("Line Style",styleLine,styleNoLabel);
x = BarIndex();
pRp  = PeakBars( H, pctH, 1) == 0;
yRp0 = SelectedValue(ValueWhen( pRp, H, HiLB));
xRp0 = SelectedValue(ValueWhen( pRp, x, HiLB));
pSp  = TroughBars( L, pctL, 1) == 0;
ySp0 = SelectedValue(ValueWhen( pSp, L, LoLB));
xSp0 = SelectedValue(ValueWhen( pSp, x, LoLB));
Delta = yRp0 - ySp0;

function fib(ret)
{
retval = (Delta * ret);
Fibval = IIf(ret < 1.0
AND xSp0 < xRp0, yRp0 - retval, IIf(ret < 1.0
AND xSp0 > xRp0, ySp0 + retval,IIf(ret > 1.0
AND xSp0 < xRp0, yRp0 - retval, IIf(ret > 1.0
AND xSp0 > xRp0, ySp0 + retval, Null))));
return FibVal;
}

x0 = Min(xSp0,xRp0)-Back;
x1 = (BarCount -1);

r236 = fib(0.236);	r236I = LastValue (r236,1);
r382 = fib(0.382);	r382I = LastValue (r382,1);
r050 = fib(0.50);		r050I = LastValue (r050,1);
r618 = fib(0.618);	r618I = LastValue (r618,1);
r786 = fib(0.786);	r786I = LastValue (r786,1);
e127 = fib(1.27);		e127I = LastValue (e127,1);
e162 = fib(1.62);		e162I = LastValue (e162,1);
e200 = fib(2.00);		e200I = LastValue (e200,1);
e262 = fib(2.62);		e262I = LastValue (e262,1);
e424 = fib(4.24);		e424I = LastValue (e424,1);

p00 = IIf(xSp0 > xRp0,ySp0,yRp0); 	p00I = LastValue (p00,1);
p100 = IIf(xSp0 < xRp0,ySp0,yRp0); 	p100I = LastValue (p100,1);
color00 =IIf(xSp0 > xRp0,colorLime,colorRed);
color100 =IIf(xSp0 < xRp0,colorLime,colorRed);

numbars = LastValue(Cum(Status("barvisible")));
fraction= IIf(StrRight(Name(),3) == "", 3.2, 3.2);

if(fibs==1)
{
Plot(LineArray(xRp0-Fwd,yRp0,x1,yRp0,Back),"PR",32,8|styleNoRescale,Null, Null,Fwd);
Plot(LineArray(xSp0-Fwd,ySp0,x1,ySp0,Back),"PS",27,8|styleNoRescale,Null, Null,Fwd);
Plot(LineArray(x0-Fwd,r236,x1,r236,Back),"",45,style|styleNoRescale,Null, Null,Fwd);
Plot(LineArray(x0-Fwd,r382,x1,r382,Back),"",44,style|styleNoRescale,Null, Null,Fwd);
Plot(LineArray(x0-Fwd,r050,x1,r050,Back),"",41,style|styleNoRescale,Null, Null,Fwd);
Plot(LineArray(x0-Fwd,r618,x1,r618,Back),"",43,style|styleNoRescale,Null, Null,Fwd);
Plot(LineArray(x0-Fwd,r786,x1,r786,Back),"",42,style|styleNoRescale,Null, Null,Fwd);
Plot(LineArray(x0-Fwd,e127,x1,e127,Back),"e127",47,style|styleNoRescale,Null, Null,Fwd);
Plot(LineArray(x0-Fwd,e162,x1,e162,Back),"e162",47,style|styleNoRescale,Null, Null,Fwd);
Plot(LineArray(x0-Fwd,e200,x1,e200,Back),"p200",47,style|styleNoRescale,Null, Null,Fwd);
Plot(LineArray(x0-Fwd,e262,x1,e262,Back),"p262",47,style|styleNoRescale,Null, Null,Fwd);
Plot(LineArray(x0-Fwd,e424,x1,e424,Back),"p424",25,style|styleNoRescale,Null, Null,Fwd);
}

if(text==1)
{
PlotText(" 0% = " + WriteVal(p00,fraction), 	LastValue(BarIndex())-(numbars/hts), p00I  + 0.05, color00);
PlotText("23% = " + WriteVal(r236,fraction), LastValue(BarIndex())-(numbars/hts), r236I + 0.05, 45);
PlotText("38% = " + WriteVal(r382,fraction), LastValue(BarIndex())-(numbars/hts), r382I + 0.05, 44);
PlotText("50% = " + WriteVal(r050,fraction), LastValue(BarIndex())-(numbars/hts), r050I + 0.05, 41);
PlotText("62% = " + WriteVal(r618,fraction), LastValue(BarIndex())-(numbars/hts), r618I + 0.05, 43);
PlotText("78% = " + WriteVal(r786,fraction), LastValue(BarIndex())-(numbars/hts), r786I + 0.05, 42);
PlotText("100% = " + WriteVal(p100,fraction), LastValue(BarIndex())-(numbars/hts),p100I + 0.05, color100);
PlotText("127% = " + WriteVal(e127,fraction), LastValue(BarIndex())-(numbars/hts),e127I + 0.05, 47);
PlotText("162% = " + WriteVal(e162,fraction), LastValue(BarIndex())-(numbars/hts),e162I + 0.05, 47);
PlotText("200% = " + WriteVal(e200,fraction), LastValue(BarIndex())-(numbars/hts),e200I + 0.05, 47);
PlotText("262% = " + WriteVal(e262,fraction), LastValue(BarIndex())-(numbars/hts),e262I + 0.05, 47);
PlotText("424% = " + WriteVal(e424,fraction), LastValue(BarIndex())-(numbars/hts),e424I + 0.05, 25);
}
_SECTION_END();

_SECTION_BEGIN("Tops-Bottoms-2-3's");
xx=BarIndex();x=xx;Lx=LastValue(x);
nbar=3;
fc=2;
frat=3;
t=H>Ref(HHV(H,frat),-1) AND Ref(HHV(H,frat),frat)<H;
PHighPrice0=ValueWhen(t,H);
b=L<Ref(LLV(L,frat),-1) AND Ref(LLV(L,frat),frat)>L;
PLowPrice0=ValueWhen(b,L);
p=H>Ref(HHV(H,nbar*fc),-1) AND Ref(HHV(H,nbar),nbar)<=H;
d=L<Ref(LLV(L,nbar*fc),-1) AND Ref(LLV(L,nbar),nbar)>=L;
pk=t OR p; tr=b OR d;

px0=ValueWhen(pk,x,0); tx0=ValueWhen(tr,x,0);
px1=ValueWhen(pk,x,1); tx1=ValueWhen(tr,x,1);
px2=ValueWhen(pk,x,2); tx2=ValueWhen(tr,x,2);
px3=ValueWhen(pk,x,3); tx3=ValueWhen(tr,x,3);
ph0=ValueWhen(pk,H,0); tl0=ValueWhen(tr,L,0);
ph1=ValueWhen(pk,H,1); tl1=ValueWhen(tr,L,1);
ph2=ValueWhen(pk,H,2); tl2=ValueWhen(tr,L,2);
ph3=ValueWhen(pk,H,3); tl3=ValueWhen(tr,L,3);

Disp2=ParamToggle("Display 2-3's Labels","Show|Hide",1);

Disp3=ParamToggle("Color Labels Behind 2-3's","Show|Hide",1);
if(Disp3){
PlotShapes(shapeSmallSquare*tr,IIf(Lx-ValueWhen(tr,x)>nbar,colorLime,colorCustom1),0,L,-10);
PlotShapes(shapeSmallSquare*pk,IIf(Lx-ValueWhen(pk,x)>nbar,ColorRGB(255,160,122),colorCustom1),0,H,10);}

dxhm=14; dxlm=10;dxh=3;dxl=2;dyhm=5;
dylm=3;dyh=5;dyl=15;hm=30;lm=30;
function GetVisibleBarCount()
{
lvb=Status("lastvisiblebar");
fvb=Status("firstvisiblebar");
return Min(lvb-fvb,BarCount-fvb);
}
function GfxConvertPixelsToBarX(Pixels)
{
lvb=Status("lastvisiblebar");
fvb=Status("firstvisiblebar");
pxchartleft=Status("pxchartleft");
pxchartwidth=Status("pxchartwidth");
fac=pxchartwidth/Pixels;
bar=(lvb-fvb)/fac;
return bar;
}
function GfxConvertPixelToValueY(Pixels)
{
local Miny,Maxy,pxchartbottom,pxchartheight;
Miny=Status("axisminy");
Maxy=Status("axismaxy");
pxchartbottom=Status("pxchartbottom");
pxchartheight=Status("pxchartheight");
fac=pxchartheight/Pixels;
Value=(Maxy-Miny)/fac;
return Value;}

if(Disp2)
{
ll=tr AND tl1<tl2; hl=tr AND tl1>tl2; hh=pk AND ph1>ph2;
lh=pk AND ph1<ph2; dt=pk AND ph1==ph2; db=tr AND tl1==tl2;

miny=Status("axisminy");
maxy=Status("axismaxy");
AllVisibleBars=GetVisibleBarCount();
fvb=Status("firstvisiblebar");
LowMargin=Miny+GfxConvertPixelToValueY(lm);
HighMargin=Maxy-GfxConvertPixelToValueY(hm);
dyllm=GfxConvertPixelToValueY(dylm);
dyhhm=GfxConvertPixelToValueY(dyhm);
dyll=GfxConvertPixelToValueY(dyl);
dyhh=GfxConvertPixelToValueY(dyh);
dxllm=GfxConvertPixelsToBarX(dxlm);
dxhhm=GfxConvertPixelsToBarX(dxhm);
dxll=GfxConvertPixelsToBarX(dxl);
dxhh=GfxConvertPixelsToBarX(dxh);

for(i=0;i<AllVisibleBars;i++)
{
if(ll[i+fvb] AND L[i+fvb]>LowMargin) PlotText("2",i+fvb+dxll,L[i+fvb]-dyll,colorBlack);
if(ll[i+fvb] AND L[i+fvb]<=LowMargin) PlotText("2",i+fvb+dxll+dxllm,L[i+fvb]-dyllm,colorBlack);
if(hl[i+fvb] AND L[i+fvb]>LowMargin) PlotText("2",i+fvb+dxll,L[i+fvb]-dyll,colorBlack);
if(hl[i+fvb] AND L[i+fvb]<=LowMargin) PlotText("2",i+fvb+dxll+dxllm,L[i+fvb]-dyllm,colorBlack);
if(db[i+fvb] AND L[i+fvb]>LowMargin) PlotText("2",i+fvb+dxll,L[i+fvb]-dyll,colorBlack);
if(db[i+fvb] AND L[i+fvb]<=LowMargin) PlotText("2",i+fvb+dxll+dxllm,L[i+fvb]-dyllm,colorBlack);
if(hh[i+fvb] AND H[i+fvb]<HighMargin) PlotText("3",i+fvb+dxhh,H[i+fvb]+dyhh,colorBlack);
if(hh[i+fvb] AND H[i+fvb]>=HighMargin) PlotText("3",i+fvb+dxhh+dxhhm,H[i+fvb]+dyhhm,colorBlack);
if(lh[i+fvb] AND H[i+fvb]<HighMargin) PlotText("3",i+fvb+dxhh,H[i+fvb]+dyhh,colorBlack);
if(lh[i+fvb] AND H[i+fvb]>=HighMargin) PlotText("3",i+fvb+dxhh+dxhhm,H[i+fvb]+dyhhm,colorBlack);
if(dt[i+fvb] AND H[i+fvb]<HighMargin) PlotText("3",i+fvb+dxhh,H[i+fvb]+dyhh,colorBlack);
if(dt[i+fvb] AND H[i+fvb]>=HighMargin) PlotText("3",i+fvb+dxhh+dxhhm,H[i+fvb]+dyhhm,colorBlack);
}}

_SECTION_END();
8 comments
Leave Comment
Please login here to leave a comment.
Nice work .. good one
SIR CAN U SAY ME GOOD TIME FRAM 5 MIN 10 MIN OR 15 MIN ANY ONE CAN TESTED THANKS
Hi anup82, 5 minutes is just fine. You could choose to work with tickcharts, they even work better.
For more information on this topic, look at: http://www.nexgent3.com/index.php
Regards,
Ceurami
very nicely done!
thank you.
Hello, I really liked the indicator its a good brain put to use.
I want to how should i condiser it as the buy signal or the sell signal should the 2 and 3 be considered as buy or sell and when and entry should be made either on close… if you could explain the system in detail would appreciate.. thanks
nice tool for trend followers.. thank you..
good i like it
Hello, can someone help me how to make these available for Ninjatrader 8? I am willing to pay a small fee if the lines are well done and can truly mimic the T3 Pro. Thank you