CROSS OVER BUY AND SELL for Amibroker (AFL)
prasadmuni almost 14 years ago Amibroker (AFL)
I have just tweaked two three different indicators after trading with them for quite some time with good results.I am not the author of this afl but it is a must in your trading arsenal.very very good results will be achived in 5 and 15 min time frame.Need to have an Rsi and macd and just play with the cross overs.
Screenshots
Indicator / Formula
Copy & Paste Friendly
//=============================SETUP================ ======================

pds = 20;
MAFAST = EMA( Close, 20 );
MASLOW = EMA( Close, 40 );

DonchianUpper = HHV( Ref( H, -1 ), pds ); // Highest high value of highs in last 20 periods
DonchianLower = LLV( Ref( L, -1 ), pds ); // Lowest low value of low in last 20 periods
DonchianMiddle = ( DonchianUpper + DonchianLower ) / 2;

UpTrend = C > ( LLV( L, 20 ) + 2 * ATR( 10 ) ) AND EMA( Close, 20 ) > EMA( Close, 40 );
DnTrend = C < ( HHV( H, 20 ) - 2 * ATR( 10 ) ) AND EMA( Close, 20 ) < EMA( Close, 40 );
Color = IIf( UpTrend, colorBlue, IIf( DnTrend, colorRed, colorCustom11 ) );

// Plots a 20 period Donchian channel
Plot( C, "Price", Color, styleBar | styleThick );


_SECTION_BEGIN("GFX EMA");
procedure Plotlinewidth(pvalue,ptitle,pcolor,pstyle,pmin,pmax,pxshift,plinewidth,pshowdate)
{
local pvalue,ptitle,pcolor,pstyle,pmin,pmax,pxshift,plinewidth,ppenstyle,pshowdate;
local Miny,Maxy; local Lvb,fvb; local pxwidth,pxheight; local TotalBars,axisarea; local i,x,y;
if(plinewidth>0 && Status("action") == 1 && (pstyle & styleLine==styleLine)){
GfxSetOverlayMode(0);
Miny=Status("axisminy"); Maxy=Status("axismaxy");
lvb=Status("lastvisiblebar"); fvb=Status("firstvisiblebar");
pxwidth=Status("pxwidth"); pxheight=Status("pxheight");
TotalBars=Lvb-fvb; xaxisarea=56;
if(pshowdate)yaxisarea=10;
else
yaxisarea=0; i=0;
x=5+i*(pxwidth-xaxisarea-10)/( TotalBars+1);
y=5+yaxisarea+(pvalue[i+fvb]-Miny)*(pxheight-yaxisarea-10)/(Maxy-Miny);
GfxMoveTo(x,pxheight - y);
for(i=1; i<TotalBars AND i<(BarCount-fvb); i++)
{
GfxSelectPen(pcolor[i + fvb],plinewidth,0);
x=5+i*(pxwidth-xaxisarea-10)/(TotalBars+1);
y=5+yaxisarea+(pvalue[i+fvb]-Miny)*(pxheight-yaxisarea-10)/(Maxy-Miny);
GfxLineTo(x,pxheight - y);
}}}
RequestTimedRefresh(2);
_SECTION_END();


_SECTION_BEGIN("Small Triggers");
p1 = Param("TL 1 Periods", 20, 5, 50, 1);
p2 = Param("TL 2 Periods", 5, 3, 25, 1);
TL1 = LinearReg(C, p1);
TL2 = EMA(TL1, p2);
Col1 = IIf(TL1 > TL2, ParamColor("TL Up Colour", colorBrightGreen), ParamColor("TL Dn Colour", colorCustom12));
Plot(TL1, "TriggerLine 1", Col1, styleLine|styleThick|styleNoLabel);
Plot(TL2, "TriggerLine 2", Col1, styleLine|styleThick|styleNoLabel);
_SECTION_END();

_SECTION_BEGIN("Large Triggers");
p3 = Param("TL 3 Periods", 80, 5, 100, 1);
p4 = Param("TL 4 Periods", 20, 3, 100, 1);
TL3 = LinearReg(C, p3);
TL4 = EMA(TL3, p4);
Col1 = IIf(TL3 > TL4, ParamColor("TLL Up Colour", colorBlue), ParamColor("TLL Dn Colour", colorRed));
Plot(TL3, "TriggerLine 3", Col1, styleLine|styleThick|styleNoLabel);
Plot(TL4, "TriggerLine 4", Col1, styleLine|styleThick|styleNoLabel);
_SECTION_END();

_SECTION_BEGIN("Fibo Retrace and Extensions");
	fibs = ParamToggle("Plot Fibs","Off|On",1);
	pctH = Param ("Pivot Hi %", 0.325,0.001,2.0,0.002);
	HiLB = Param ("Hi LookBack",1,1,BarCount-1,1);
	pctL = Param ("Pivot Lo %", 0.325,0.001,2.0,0.002);
	LoLB = Param ("Lo LookBack",1,1,BarCount-1,1);
	Back = Param ("Extend Left = 2",1,1,500,1);
	Fwd  = Param("Plot Forward", 0, 0, 500, 1);
	text = ParamToggle("Plot Text","Off|On",1);
	hts  = Param ("Text Shift", -33.5,-50,50,0.10);
	style =ParamStyle("Line Style",styleLine,styleNoLabel);
x = BarIndex();
pRp  = PeakBars( H, pctH, 1) == 0;
yRp0 = SelectedValue(ValueWhen( pRp, H, HiLB));
xRp0 = SelectedValue(ValueWhen( pRp, x, HiLB));
pSp  = TroughBars( L, pctL, 1) == 0;
ySp0 = SelectedValue(ValueWhen( pSp, L, LoLB));
xSp0 = SelectedValue(ValueWhen( pSp, x, LoLB));
Delta = yRp0 - ySp0;

function fib(ret)
{
retval = (Delta * ret);
Fibval = IIf(ret < 1.0
AND xSp0 < xRp0, yRp0 - retval, IIf(ret < 1.0
AND xSp0 > xRp0, ySp0 + retval,IIf(ret > 1.0
AND xSp0 < xRp0, yRp0 - retval, IIf(ret > 1.0
AND xSp0 > xRp0, ySp0 + retval, Null))));
return FibVal;
}

x0 = Min(xSp0,xRp0)-Back;
x1 = (BarCount -1);

r236 = fib(0.236);	r236I = LastValue (r236,1);
r382 = fib(0.382);	r382I = LastValue (r382,1);
r050 = fib(0.50);		r050I = LastValue (r050,1);
r618 = fib(0.618);	r618I = LastValue (r618,1);
r786 = fib(0.786);	r786I = LastValue (r786,1);
e127 = fib(1.27);		e127I = LastValue (e127,1);
e162 = fib(1.62);		e162I = LastValue (e162,1);
e200 = fib(2.00);		e200I = LastValue (e200,1);
e262 = fib(2.62);		e262I = LastValue (e262,1);
e424 = fib(4.24);		e424I = LastValue (e424,1);

p00 = IIf(xSp0 > xRp0,ySp0,yRp0); 	p00I = LastValue (p00,1);
p100 = IIf(xSp0 < xRp0,ySp0,yRp0); 	p100I = LastValue (p100,1);
color00 =IIf(xSp0 > xRp0,colorLime,colorRed);
color100 =IIf(xSp0 < xRp0,colorLime,colorRed);

numbars = LastValue(Cum(Status("barvisible")));
fraction= IIf(StrRight(Name(),3) == "", 3.2, 3.2);

if(fibs==1)
{
Plot(LineArray(xRp0-Fwd,yRp0,x1,yRp0,Back),"PR",32,8|styleNoRescale,Null, Null,Fwd);
Plot(LineArray(xSp0-Fwd,ySp0,x1,ySp0,Back),"PS",27,8|styleNoRescale,Null, Null,Fwd);
Plot(LineArray(x0-Fwd,r236,x1,r236,Back),"",45,style|styleNoRescale,Null, Null,Fwd);
Plot(LineArray(x0-Fwd,r382,x1,r382,Back),"",44,style|styleNoRescale,Null, Null,Fwd);
Plot(LineArray(x0-Fwd,r050,x1,r050,Back),"",41,style|styleNoRescale,Null, Null,Fwd);
Plot(LineArray(x0-Fwd,r618,x1,r618,Back),"",43,style|styleNoRescale,Null, Null,Fwd);
Plot(LineArray(x0-Fwd,r786,x1,r786,Back),"",42,style|styleNoRescale,Null, Null,Fwd);
Plot(LineArray(x0-Fwd,e127,x1,e127,Back),"e127",47,style|styleNoRescale,Null, Null,Fwd);
Plot(LineArray(x0-Fwd,e162,x1,e162,Back),"e162",47,style|styleNoRescale,Null, Null,Fwd);
Plot(LineArray(x0-Fwd,e200,x1,e200,Back),"p200",47,style|styleNoRescale,Null, Null,Fwd);
Plot(LineArray(x0-Fwd,e262,x1,e262,Back),"p262",47,style|styleNoRescale,Null, Null,Fwd);
Plot(LineArray(x0-Fwd,e424,x1,e424,Back),"p424",25,style|styleNoRescale,Null, Null,Fwd);
}

if(text==1)
{
PlotText(" 0% = " + WriteVal(p00,fraction), 	LastValue(BarIndex())-(numbars/hts), p00I  + 0.05, color00);
PlotText("23% = " + WriteVal(r236,fraction), LastValue(BarIndex())-(numbars/hts), r236I + 0.05, 45);
PlotText("38% = " + WriteVal(r382,fraction), LastValue(BarIndex())-(numbars/hts), r382I + 0.05, 44);
PlotText("50% = " + WriteVal(r050,fraction), LastValue(BarIndex())-(numbars/hts), r050I + 0.05, 41);
PlotText("62% = " + WriteVal(r618,fraction), LastValue(BarIndex())-(numbars/hts), r618I + 0.05, 43);
PlotText("78% = " + WriteVal(r786,fraction), LastValue(BarIndex())-(numbars/hts), r786I + 0.05, 42);
PlotText("100% = " + WriteVal(p100,fraction), LastValue(BarIndex())-(numbars/hts),p100I + 0.05, color100);
PlotText("127% = " + WriteVal(e127,fraction), LastValue(BarIndex())-(numbars/hts),e127I + 0.05, 47);
PlotText("162% = " + WriteVal(e162,fraction), LastValue(BarIndex())-(numbars/hts),e162I + 0.05, 47);
PlotText("200% = " + WriteVal(e200,fraction), LastValue(BarIndex())-(numbars/hts),e200I + 0.05, 47);
PlotText("262% = " + WriteVal(e262,fraction), LastValue(BarIndex())-(numbars/hts),e262I + 0.05, 47);
PlotText("424% = " + WriteVal(e424,fraction), LastValue(BarIndex())-(numbars/hts),e424I + 0.05, 25);
}
_SECTION_END();

_SECTION_BEGIN("Pivot Finder for Amibroker");
//  /* **********************************
//
//  Code to automatically identify pivots
//
//  ********************************** */
//
//  // -- what will be our lookback range for the hh and ll?
//
//  farback=Param("How Far back to go",100,50,5000,10);
//
//  nBars = Param("Number of bars", 12, 5, 40);
//
//  // -- Title.
//
//  Title = Name() + " (" + StrLeft(FullName(), 15) + ") O: " + Open + ",
//
//  H: " + High + ", L: " + Low + ", C: " + Close;
//
//  // -- Plot basic candle chart
//
//  PlotOHLC(Open, High, Low, Close,
//
//  "BIdx = " + BarIndex() +
//
//  "\n" + "O = " + O + "\n"+"H = "+ H + "\n"+"L = " + L
//
//  + "\n"+"C ",
//
//  colorYellow, stylecandle);
//
//  GraphXSpace=7;
//
//  // -- Create 0-initialized arrays the size of barcount
//
//  aHPivs = H - H;
//
//  aLPivs = L - L;
//
//  // -- More for future use, not necessary for basic plotting
//
//  aHPivHighs = H - H;
//
//  aLPivLows = L - L;
//
//  aHPivIdxs = H - H;
//
//  aLPivIdxs = L - L;
//
//  nHPivs = 0;
//
//  nLPivs = 0;
//
//  lastHPIdx = 0;
//
//  lastLPIdx = 0;
//
//  lastHPH = 0;
//
//  lastLPL = 0;
//
//  curPivBarIdx = 0;
//
//  // -- looking back from the current bar, how many bars
//
//  // back were the hhv and llv values of the previous
//
//  // n bars, etc.?
//
//  aHHVBars = HHVBars(H, nBars);
//
//  aLLVBars = LLVBars(L, nBars);
//
//  aHHV = HHV(H, nBars);
//
//  aLLV = LLV(L, nBars);
//
//  // -- Would like to set this up so pivots are calculated back from
//
//  // last visible bar to make it easy to "go back" and see the pivots
//
//  // this code would find. However, the first instance of
//
//  // _Trace output will show a value of 0
//
//  aVisBars = Status("barvisible");
//
//  nLastVisBar = LastValue(Highest(IIf(aVisBars, BarIndex(), 0)));
//
//  _TRACE("Last visible bar: " + nLastVisBar);
//
//  // -- Initialize value of curTrend
//
//  curBar = (BarCount-1);
//
//  curTrend = "";
//
//  if (aLLVBars[curBar] <
//
//  aHHVBars[curBar]) {
//
//  curTrend = "D";
//
//  }
//
//  else {
//
//  curTrend = "U";
//
//  }
//
//  // -- Loop through bars. Search for
//
//  // entirely array-based approach
//
//  // in future version
//
//  for (i=0; i<farback; i++) {
//
//  curBar = (BarCount - 1) - i;
//
//  // -- Have we identified a pivot? If trend is down...
//
//  if (aLLVBars[curBar] < aHHVBars[curBar]) {
//
//  // ... and had been up, this is a trend change
//
//  if (curTrend == "U") {
//
//  curTrend = "D";
//
//  // -- Capture pivot information
//
//  curPivBarIdx = curBar - aLLVBars[curBar];
//
//  aLPivs[curPivBarIdx] = 1;
//
//  aLPivLows[nLPivs] = L[curPivBarIdx];
//
//  aLPivIdxs[nLPivs] = curPivBarIdx;
//
//  nLPivs++;
//
//  }
//
//  // -- or current trend is up
//
//  } else {
//
//  if (curTrend == "D") {
//
//  curTrend = "U";
//
//  curPivBarIdx = curBar - aHHVBars[curBar];
//
//  aHPivs[curPivBarIdx] = 1;
//
//  aHPivHighs[nHPivs] = H[curPivBarIdx];
//
//  aHPivIdxs[nHPivs] = curPivBarIdx;
//
//  nHPivs++;
//
//  }
//
//  // -- If curTrend is up...else...
//
//  }
//
//  // -- loop through bars
//
//  }
//
//  // -- Basic attempt to add a pivot this logic may have missed
//
//  // -- OK, now I want to look at last two pivots. If the most
//
//  // recent low pivot is after the last high, I could
//
//  // still have a high pivot that I didn't catch
//
//  // -- Start at last bar
//
//  curBar = (BarCount-1);
//
//  candIdx = 0;
//
//  candPrc = 0;
//
//  lastLPIdx = aLPivIdxs[0];
//
//  lastLPL = aLPivLows[0];
//
//  lastHPIdx = aHPivIdxs[0];
//
//  lastHPH = aHPivHighs[0];
//
//  if (lastLPIdx > lastHPIdx) {
//
//  // -- Bar and price info for candidate pivot
//
//  candIdx = curBar - aHHVBars[curBar];
//
//  candPrc = aHHV[curBar];
//
//  if (
//
//  lastHPH < candPrc AND
//
//  candIdx > lastLPIdx AND
//
//  candIdx < curBar) {
//
//  // -- OK, we'll add this as a pivot...
//
//  aHPivs[candIdx] = 1;
//
//  // ...and then rearrange elements in the
//
//  // pivot information arrays
//
//  for (j=0; j<nHPivs; j++) {
//
//  aHPivHighs[nHPivs-j] = aHPivHighs[nHPivs-
//
//  (j+1)];
//
//  aHPivIdxs[nHPivs-j] = aHPivIdxs[nHPivs-(j+1)];
//
//  }
//
//  aHPivHighs[0] = candPrc ;
//
//  aHPivIdxs[0] = candIdx;
//
//  nHPivs++;
//
//  }
//
//  } else {
//
//  // -- Bar and price info for candidate pivot
//
//  candIdx = curBar - aLLVBars[curBar];
//
//  candPrc = aLLV[curBar];
//
//  if (
//
//  lastLPL > candPrc AND
//
//  candIdx > lastHPIdx AND
//
//  candIdx < curBar) {
//
//  // -- OK, we'll add this as a pivot...
//
//  aLPivs[candIdx] = 1;
//
//  // ...and then rearrange elements in the
//
//  // pivot information arrays
//
//  for (j=0; j<nLPivs; j++) {
//
//  aLPivLows[nLPivs-j] = aLPivLows[nLPivs-(j+1)];
//
//  aLPivIdxs[nLPivs-j] = aLPivIdxs[nLPivs-(j+1)];
//
//  }
//
//  aLPivLows[0] = candPrc;
//
//  aLPivIdxs[0] = candIdx;
//
//  nLPivs++;
//
//  }
//
//  }
//
//  // -- Dump inventory of high pivots for debugging
//
//  /*
//
//  for (k=0; k<nHPivs; k++) {
//
//  _TRACE("High pivot no. " + k
//
//  + " at barindex: " + aHPivIdxs[k] + ", "
//
//  + WriteVal(ValueWhen(BarIndex()==aHPivIdxs[k],
//
//  DateTime(), 1), formatDateTime)
//
//  + ", " + aHPivHighs[k]);
//
//  }
//
//  */
//
//  // -- OK, let's plot the pivots using arrows
//
//  PlotShapes(
//
//  IIf(aHPivs==1, shapeDownArrow, shapeNone), colorRed, 0,
//
//  High, Offset=-15);
//
//  PlotShapes(
//
//  IIf(aLPivs==1, shapeUpArrow , shapeNone), colorGreen, 0,
//
//  Low, Offset=-15);
//
//------------------------------------------------------------------------------

  /* **********************************

Code to automatically identify pivots

********************************** */

// -- what will be our lookback range for the hh and ll?
farback=Param("How Far back to go",100,50,5000,10);
nBars = Param("Number of bars", 12, 5, 40);

// -- Title.

Title = Name() + " (" + StrLeft(FullName(), 15) + ") O: " + Open + ",

H: " + High + ", L: " + Low + ", C: " + Close;

// -- Plot basic candle chart

PlotOHLC(Open, High, Low, Close,

"BIdx = " + BarIndex() +

"\n" + "O = " + O + "\n"+"H = "+ H + "\n"+"L = " + L

+ "\n"+"C ",

colorBlack, styleBar);

GraphXSpace=7;

// -- Create 0-initialized arrays the size of barcount

aHPivs = H - H;

aLPivs = L - L;

// -- More for future use, not necessary for basic plotting

aHPivHighs = H - H;

aLPivLows = L - L;

aHPivIdxs = H - H;

aLPivIdxs = L - L;

nHPivs = 0;

nLPivs = 0;

lastHPIdx = 0;

lastLPIdx = 0;

lastHPH = 0;

lastLPL = 0;

curPivBarIdx = 0;

// -- looking back from the current bar, how many bars

// back were the hhv and llv values of the previous

// n bars, etc.?

aHHVBars = HHVBars(H, nBars);

aLLVBars = LLVBars(L, nBars);

aHHV = HHV(H, nBars);

aLLV = LLV(L, nBars);

// -- Would like to set this up so pivots are calculated back from

// last visible bar to make it easy to "go back" and see the pivots

// this code would find. However, the first instance of

// _Trace output will show a value of 0

aVisBars = Status("barvisible");

nLastVisBar = LastValue(Highest(IIf(aVisBars, BarIndex(), 0)));

_TRACE("Last visible bar: " + nLastVisBar);

// -- Initialize value of curTrend

curBar = (BarCount-1);

curTrend = "";

if (aLLVBars[curBar] <

aHHVBars[curBar]) {

curTrend = "D";

}

else {

curTrend = "U";

}

// -- Loop through bars. Search for

// entirely array-based approach

// in future version

for (i=0; i<farback; i++) {

curBar = (BarCount - 1) - i;

// -- Have we identified a pivot? If trend is down...

if (aLLVBars[curBar] < aHHVBars[curBar]) {

// ... and had been up, this is a trend change

if (curTrend == "U") {

curTrend = "D";

// -- Capture pivot information

curPivBarIdx = curBar - aLLVBars[curBar];

aLPivs[curPivBarIdx] = 1;

aLPivLows[nLPivs] = L[curPivBarIdx];

aLPivIdxs[nLPivs] = curPivBarIdx;

nLPivs++;

}

// -- or current trend is up

} else {

if (curTrend == "D") {

curTrend = "U";

curPivBarIdx = curBar - aHHVBars[curBar];

aHPivs[curPivBarIdx] = 1;

aHPivHighs[nHPivs] = H[curPivBarIdx];

aHPivIdxs[nHPivs] = curPivBarIdx;

nHPivs++;

}

// -- If curTrend is up...else...

}

// -- loop through bars

}

// -- Basic attempt to add a pivot this logic may have missed

// -- OK, now I want to look at last two pivots. If the most

// recent low pivot is after the last high, I could

// still have a high pivot that I didn't catch

// -- Start at last bar

curBar = (BarCount-1);

candIdx = 0;

candPrc = 0;

lastLPIdx = aLPivIdxs[0];

lastLPL = aLPivLows[0];

lastHPIdx = aHPivIdxs[0];

lastHPH = aHPivHighs[0];

if (lastLPIdx > lastHPIdx) {

// -- Bar and price info for candidate pivot

candIdx = curBar - aHHVBars[curBar];

candPrc = aHHV[curBar];

if (

lastHPH < candPrc AND

candIdx > lastLPIdx AND

candIdx < curBar) {


// -- OK, we'll add this as a pivot...

aHPivs[candIdx] = 1;

// ...and then rearrange elements in the

// pivot information arrays

for (j=0; j<nHPivs; j++) {

aHPivHighs[nHPivs-j] = aHPivHighs[nHPivs-

(j+1)];

aHPivIdxs[nHPivs-j] = aHPivIdxs[nHPivs-(j+1)];

}

aHPivHighs[0] = candPrc ;

aHPivIdxs[0] = candIdx;

nHPivs++;

}

} else {


// -- Bar and price info for candidate pivot

candIdx = curBar - aLLVBars[curBar];

candPrc = aLLV[curBar];

if (

lastLPL > candPrc AND

candIdx > lastHPIdx AND

candIdx < curBar) {


// -- OK, we'll add this as a pivot...

aLPivs[candIdx] = 1;

// ...and then rearrange elements in the

// pivot information arrays

for (j=0; j<nLPivs; j++) {

aLPivLows[nLPivs-j] = aLPivLows[nLPivs-(j+1)];

aLPivIdxs[nLPivs-j] = aLPivIdxs[nLPivs-(j+1)];

}

aLPivLows[0] = candPrc;

aLPivIdxs[0] = candIdx;

nLPivs++;

}

}

// -- Dump inventory of high pivots for debugging

/*

for (k=0; k<nHPivs; k++) {

_TRACE("High pivot no. " + k

+ " at barindex: " + aHPivIdxs[k] + ", "

+ WriteVal(ValueWhen(BarIndex()==aHPivIdxs[k],

DateTime(), 1), formatDateTime)

+ ", " + aHPivHighs[k]);

}

*/

// -- OK, let's plot the pivots using arrows

PlotShapes(

IIf(aHPivs==1, shapeHollowDownArrow, shapeNone), colorRed, 0,

High, Offset=-15);

PlotShapes(

IIf(aLPivs==1, shapeHollowUpArrow , shapeNone), colorBrightGreen, 0,

Low, Offset=-15);
_SECTION_END();


SetChartBkGradientFill( ParamColor("BgTop", ColorRGB( 172,172,172 )),

ParamColor("BgBottom", ColorRGB( 172,172,172 )),ParamColor("titleblock",ColorRGB( 172,172,172 )));
16 comments
Leave Comment
Please login here to leave a comment.
Hi Prasadmuni do you have below RSI AFL. IF yes pls upload or mail me at wecnd @ indiatimes.com Thanks for your help.
very nice indicator would you please share your RSI code as it looks very good.
Thanks in advance
Hi, Macd colored attached here.
Hi, RSI ia attched here
Prasadmuni,
Welldone & its nice system on small timeframes.
what about for highet time frame for 1 hour chart? what are results?
Thanks
Viswanath
thanks a lot guys :)
Dear kv_maligi your code gives me lots of error kindly check
thanks
Thanks Prasadmuni and kv_maligi… All codes are working.
Dear isc0rpi0,
what is error message ? I am using lastest version of AMI. There are working fine
thanks
viswanath
Dear Prasadmuni,
Please give some tips on fixing target, SL & also entry ( i mean to enter immeditely on signal or wait for breakout)
Thanks
Viswanath
dear kv_maligi my bad code is working fine :)
thanks a lot
sir please give some guidelines for trading with this nice afl thanks
Dear friends i have posted a version 2 of crossover buy and sell and administrator may post it soon.Provided all stoploss and time frames on it.
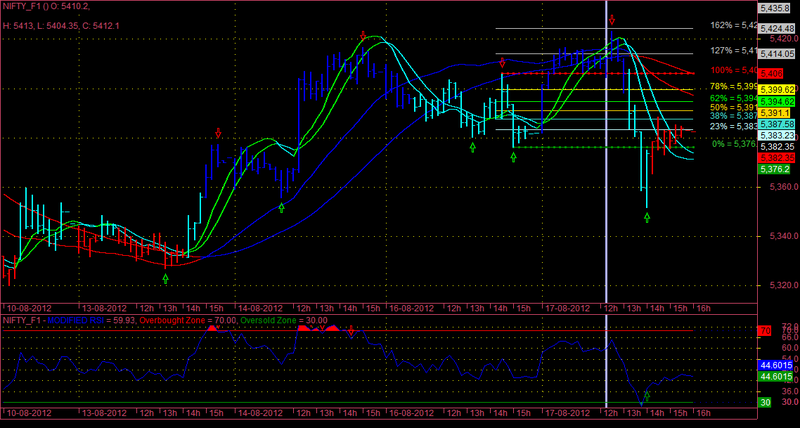
The blue and the red lines/cross over is a larger time frame crossover.The green and turquoise color lines are the shorter time frame period cross over.As soon as you see the larger time frame crossing over bullish or bearish and the smaller tf crossing in the same direction then that crossover is the trend.Comming to targets look for the fibonacci ext and ret levels to book profits gradually.The pivot arrows act as a great trend identifier.Anyway as the 2nd version will be posted soon all this factors are factored in.Mr Maligi not good in hourly time frame as there is a lag and trade has started or getting over.Best time frame is 5 min tf and look for 15 min tf just to confirm trend and continue.your rsi and macd afls are fine for our other friends and no need for me to post the same.wish you all luck brothers.Prasad
Kindly paste the formula over here if u can
I get error at
if (aLLVBars[curBar] < aHHVBars[curBar]) {
Ln:597 Col 20 Error 10. Array subscript out of range…
thanks