Stock Portfolio Organizer
The ultimate porfolio management solution.
WiseTrader Toolbox
#1 Selling Amibroker Plugin featuring:
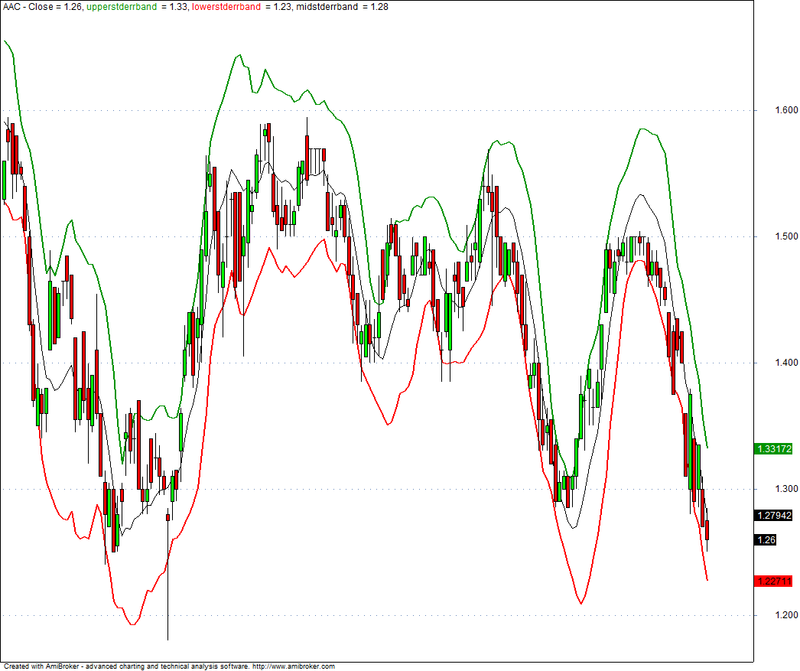
Standard Error Bands for Amibroker (AFL)
Description:
Standard Error Bands are a type of envelope developed by Jon Andersen. They are similar to Bollinger Bands in appearance, but they are calculated and interpreted quite differently. Where Bollinger Bands are plotted at standard deviation levels above and below a moving average, Standard Error Bands are plotted at standard error levels above and below a linear regression plot.
Interpretation:
When using Standard Error Bands, you are required to enter the number of periods in the bands. Mr. Andersen recommends default values of “21” for the number of periods, a 3-day simple moving average for the smoothing, and “2” standard errors. He also notes that very short time frames tend to produce unreliable results. These interpretational comments refer to bands on the security’s closing price.
Because the spacing between Standard Error Bands is based on the standard error of the security, the bands widen when the volatility around the current trend increases, and contract when volatility around the current trend decreases. Since Standard Error Bands are statistically based, other statistical indicators such as r-squared, Standard Error, Linear Regression, etc. work well for trade confirmation.
Mr. Andersen notes the following characteristics of Standard Error Bands.
- Tight bands are an indication of a strong trend.
- Prices tend to bounce between the bands when the bands are wide.
- Tight bands followed by a widening of the bands may indicate the exhaustion of a trend and a possible reversal.
- When the bands reverse direction after an exhausted trend, prices tend to move in the direction of the bands.
- The r-squared indicator works well in combination with Standard Error Bands. A high r-squared value combined with tight bands confirms a strong trend. A low r-squared value combined with wide bands confirms that prices are consolidating.
By William Peters – williampeters [at] sympatico.ca
Screenshots
Indicator / Formula
/* Standard Error Bands */
Periods = Param("Standard Error", 18, 1, 100, 1);

function SteBand( array, periods, upper )
{
  Lr = LinearReg( array, periods );
  se = StdErr( array, periods );
  return LR + IIf( upper, 1, -1 ) * 2 * se;
}

upperstderrband = SteBand( C, Periods, True );
lowerstderrband = SteBand( C, Periods, False );
midstderrband = (upperstderrband + lowerstderrband )/2;

Plot( Close, "Close", colorBlack, styleCandle );
Plot( upperstderrband , "upperstderrband ", colorGreen, 4 );
Plot( lowerstderrband , "lowerstderrband ", colorRed, 4 );
Plot( midstderrband , "midstderrband ", colorBlack , styleLine);

GraphXSpace = 3;
0 comments
Leave Comment
Please login here to leave a comment.
Back