Trend Score Price Color for Amibroker (AFL)
amon almost 14 years ago Amibroker (AFL)
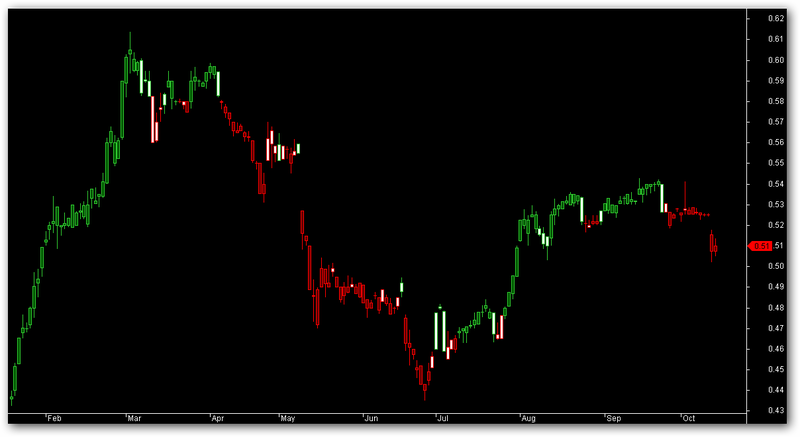
Recently I posted TScore Monitor buyed last year. This is an aplication of TScore formula on the price.
Fill color:
DarkGreen – up trend
DarkRed – down trend
White – warning about a possible change of the trend
Body outline color:
Lime – TScore>0
Red – Tscore<0
Screenshots
Indicator / Formula
Copy & Paste Friendly
_SECTION_BEGIN("TScore Price Color");
//*********************************************************
   //http://forexsection.blogspot.com/
   //writted by Emmen
   //Trend Score Price Color
//*********************************************************

HaClose =EMA((O+H+L+C)/4,3);  // Woodie
HaOpen = IIf(BarIndex()>0,AMA( Ref( HaClose, -1 ), 0.5 ),Open);
HaHigh = Max( H, Max( HaClose, HaOpen ) );
HaLow = Min( L, Min( HaClose, HaOpen ) );

p1=Param("Extreme period1",5,3,10);
p2=Param("Extreme period2",8,3,20);
p3=Param("Extreme period3",13,3,50);
sc=Param("Score Limit",3,1,7);

HaDiff = IIf(HaClose>HaOpen, 1, IIf((O+H+L+C)/4<HaOpen,-1,0));
HaDiff1 = IIf(HaClose>EMA(HaClose,p1), 1, IIf(HaClose<EMA(HaClose,p1),-1,0));
HaDiff2 = IIf(HaClose>EMA(HaClose,p2), 1, IIf(HaClose<EMA(HaClose,p2),-1,0));
HaDiff3 = IIf(HaClose>EMA(HaClose,p3), 1, IIf(HaClose<EMA(HaClose,p3),-1,0));
HaDiff4 = IIf(EMA(HaClose,p1)>EMA(HaClose,p2), 1, IIf(EMA(HaClose,p1)<EMA(HaClose,p2),-1,0));
HaDiff5 = IIf(EMA(HaClose,p2)>EMA(HaClose,p3), 1, IIf(EMA(HaClose,p2)<EMA(HaClose,p3),-1,0));
HaDiff6 = IIf(HaClose>Ref(HaClose,-1), 1, IIf(HaClose<Ref(HaClose,-1),-1,0));

TScore = HaDiff + HaDiff1 + HaDiff2 + HaDiff3 + HaDiff4 + HaDiff5 + HaDiff6;

FillColor = IIf(TScore>sc AND NOT (Ref(TScore,-1)<sc AND Avg<Ref(Avg,-1)),colorDarkGreen,
        IIf(TScore<-sc AND NOT (Ref(TScore,-1)>-sc AND Avg>Ref(Avg,-1)),ColorRGB(100,0,0),colorWhite));
mycolor=IIf(Tscore>0, colorLime,colorRed);

SetBarFillColor(Fillcolor);

PlotOHLC(O,H,L,C,"Candlestick",myColor,styleCandle|styleLine);
_SECTION_END();
3 comments
Leave Comment
Please login here to leave a comment.
It is more useful if u drop Tscore Meter on this Coloured Price chart (combination is useful)
http://wisestocktrader.com/indicators/3266-tscore
Test it n enjoy.
Good charting
thanks
viswanath
This is good alf. Thanks for posting!