modifed Mike for Amibroker (AFL)
njethva over 13 years ago Amibroker (AFL)
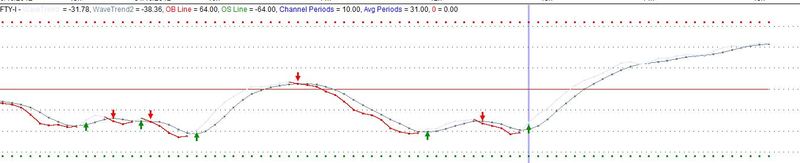
i have modified Mike indicator with Buy and sale signal.
hope u guys like it
Screenshots
Indicator / Formula
Copy & Paste Friendly
_SECTION_BEGIN("MIKE");
ChannelPeriods = Param("Channel Periods",10,1,50,1);
AvgPeriods = Param("Average Periods",31,1,50,1);
OverBought = Param("Over Bought Line",64,0,100,1);
OverSold = Param("Over Sold Line",-64,-100,0,1);
ColTCI = ParamColor("TCI Line Color",colorBrown);
ColOB = ParamColor("Over Bought Color",colorRed);
ColOS = ParamColor("Over Sold",colorGreen);
XSpace = Param("GraphXSpace",7,0,20,0.5);

n1 = ChannelPeriods; // Channel periodsdefault is 10.
n2 = AvgPeriods; // Average periodsdefault is 31.

AP = Avg; //Typical Price
ESA = EMA(AP, n1);
D = EMA(abs(AP - ESA), n1);
CI = (AP - ESA) / (0.015 * D);
TCI = EMA(CI, n2);

WaveTrend1 = TCI;
WaveTrend2 = MA(WaveTrend1,4);

myColor =
IIf (WaveTrend1 > WaveTrend2, colorLavender,
IIf (WaveTrend2 > WaveTrend1, colorRed ,colorLightYellow));

Plot(WaveTrend1,"WaveTrend ",myColor,styleDots | styleThick);

//Plot(WaveTrend2,"WaveTrend2",colorLightYellow,styl eDashed);
Plot(WaveTrend2,"WaveTrend2",ParamColor("Signal Line color", colorPaleBlue),styleDots);

Plot(OverBought,"OB Line",ColOB,8+16);//|styleNoLabel);//8+16
Plot(OverSold,"OS Line",ColOS,8+16);//|styleNoLabel);
Plot(n1,"Channel Periods",colorBlue,styleNoLabel |styleNoRescale |styleNoDraw);
Plot(n2,"Avg Periods",colorBlue,styleNoLabel |styleNoRescale | styleNoDraw);
Plot(0,"0",colorRed,styleNoLabel);
//Plot(100,"",9 ,styleOwnScale | styleArea | styleNoLabel,-5,100);
//Background pane coloring

GraphXSpace = XSpace;

_SECTION_END();

_SECTION_BEGIN("Buy Sell Signal");
x = WaveTrend1;
y = WaveTrend2;

Buy=Cross(x,y);
Sell=Cross(y,x);
Buy = ExRem(Buy, Sell);
Sell = ExRem(Sell, Buy);

PlotShapes(shapeUpArrow*Buy,colorGreen);
PlotShapes(shapeDownArrow*Sell,colorRed);
_SECTION_END ();
2 comments
Leave Comment
Please login here to leave a comment.
Great job…..njethva I like your work
for more better result, you can replace EMA with Wilders.