Modified Flipit Indicator for Amibroker (AFL)
sbtc555 over 13 years ago Amibroker (AFL)
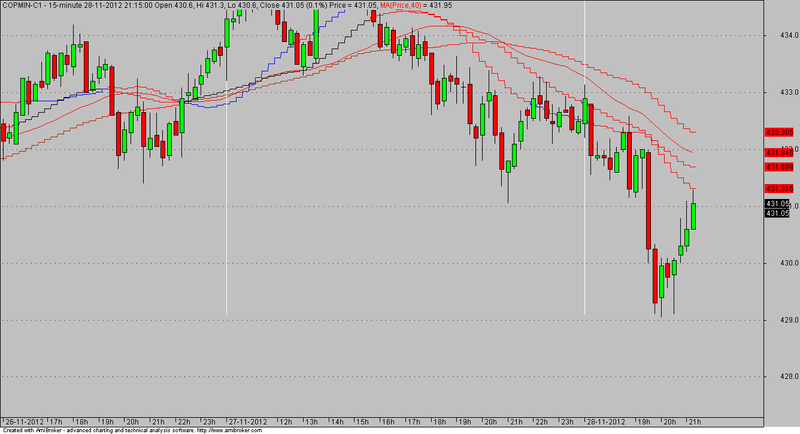
The basic concept of Flip it remains except that there are 3 Flipit and a SMA (40) added. The 1st Flipit has parameter of 20 based on the High and low of previous 20 bars, 2nd Flipit has parameter of 30 based on High and low of previous 20 bars and the 3rd Flipit has parameter of 50 based on High and low of previous 50 bars.
Rules for Buying:
Buy bar above SMAand all 3 flip it in respective colors
Add on Buy: If Add on buy above SMA but Flip it 20 is showing Red color, then it warrants for an Add on Buy.
Rules for Selling:
Sell bar below SMA and all 3 flip it in red color.
Add on Sell: If Add on Sell below SMA but Flip it 20 is showing respective buy color, then it warrants for an Add on Sell.
Screenshots
Indicator / Formula
_SECTION_BEGIN("Price");
SetChartOptions(0,chartShowArrows|chartShowDates);
SetBarsRequired(sbrAll,sbrAll);
SetBarFillColor(IIf(C>O,ParamColor("Candle Up Color", colorBrightGreen),IIf(C<=O,ParamColor("Candle Down Color", colorRed),colorLightGrey)));
Plot(C,"Price",IIf(C>O,ParamColor("Shadow Up Color", colorBlack),IIf(C<=O,ParamColor("Shadow Down Color", colorBlack),colorLightGrey)),64,0,0,0,0);
SetChartBkColor(ParamColor("Panel Color ",colorLightGrey));
SetChartBkGradientFill(ParamColor("Upper Chart",colorLightGrey),ParamColor("Lower Chart",colorLightGrey));

grid_day = IIf(Day()!=Ref(Day(),-1),1,0);
Plot(grid_day,"",colorWhite,styleHistogram|styleDots|styleNoLabel|styleOwnScale);


_N(Title = StrFormat("{{NAME}} - {{INTERVAL}} {{DATE}} Open %g, Hi %g, Lo %g, Close %g (%.1f%%) {{VALUES}}", O, H, L, C, SelectedValue( ROC( C, 1 ) ) ));
Plot( C, "Close", ParamColor("Price Color", colorBlack ), styleNoTitle | ParamStyle("Price Style") | GetPriceStyle() );


_SECTION_END();

t1=Param("t1", 20, -20);

Top = Sum(High, t1) / t1;
Bottom = Sum(Low, t1) / t1;
av1=(Top+Bottom)/2;
mc=IIf(av1>C, colorRed, colorBlue);
Plot(av1, "", mc, styleStaircase);

t2=Param("t2", 30, -30);

Top = Sum(High, t2) / t2;
Bottom = Sum(Low, t2) / t2;
av2=(Top+Bottom)/2;
mc=IIf(av2>C, colorRed, colorBlack);
Plot(av2, "", mc, styleStaircase);

t3=Param("t3", 50, -50);

Top = Sum(High, t3) / t3;
Bottom = Sum(Low, t3) / t3;
av3=(Top+Bottom)/2;
mc=IIf(av3>C, colorRed, colorBrown);
Plot(av3, "", mc, styleStaircase);

_SECTION_BEGIN("MA");
P = ParamField("Price field",-1);
Periods = Param("Periods", 20);
Plot( MA( P, Periods ), _DEFAULT_NAME(), ParamColor( "Color", colorCycle ), ParamStyle("Style") );
_SECTION_END();
5 comments
Leave Comment
Please login here to leave a comment.
Thanx Dear
for presenting the improved AFL
and its better interpretation.
Good modification but.
buy-sell signal and Scanning/Exploration not available.
Kindly add it to make it extra-ordinary Afl
Thanx you
I think that this indicator is just Ma at 20, 30 and 50 so identical to Cross Ma that I saw some month ago in this site.
I also do not see any difference between SMA20 and t1. They have the same behavior.
Its really good formula. change properties. if possible please give your mail id. Thank u.