Keltner Cloud With VWAP for Amibroker (AFL)
mottai2010 over 13 years ago Amibroker (AFL)
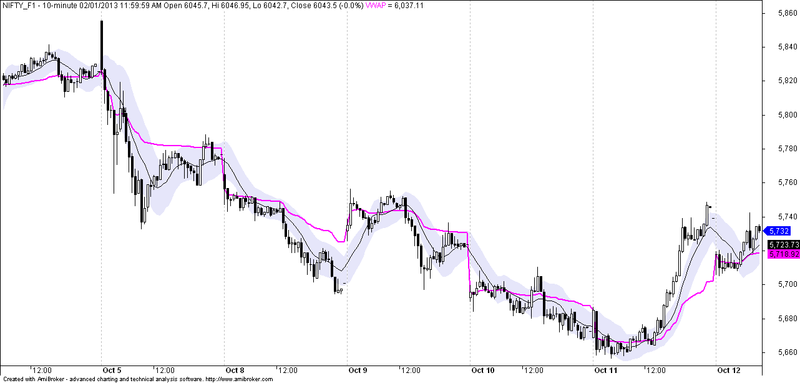
A simple AFL for trading.
Longs : Price should be above VWAP and should close above the Keltner cloud. Intiate longs with stoploss at the opposite side of the Keltner cloud. Vice-versa for shorts.
Screenshots
Indicator / Formula
Copy & Paste Friendly
_SECTION_BEGIN("Price");
SetChartOptions(0,chartShowArrows|chartShowDates);
_N(Title = StrFormat("{{NAME}} - {{INTERVAL}} {{DATE}} Open %g, Hi %g, Lo %g, Close %g (%.1f%%) {{VALUES}}", O, H, L, C, SelectedValue( ROC( C, 1 ) ) ));
Plot( C, "Close", ParamColor("Color", colorBlack ), styleNoTitle | ParamStyle("Style") | GetPriceStyle() );
_SECTION_END();

_SECTION_BEGIN("Keltner_sideways");
kt = MA(H,10) + 0.5*ATR(10);
kb = MA(L,10) -  0.5*ATR(10);

km = (kb+kt)/2;

PlotOHLC(kb,kb,kt,kt,"",colorLavender,styleCloud|styleNoRescale|styleNoLabel,Null,Null,0,-3);

Plot(km,"",colorBlack,styleLine|styleNoRescale|Null,Null,0,-1);
_SECTION_END();

_SECTION_BEGIN("VWAP");
/*
The VWAP for a stock is calculated by adding the dollars traded for every
transaction in that stock ("price" x "number of
      shares traded") and dividing the total shares traded. A VWAP is computed
from the Open of the market to the market Close, AND is
      calculated by Volume weighting all transactions during this time period
*/

Bars_so_far_today = 1 + BarsSince( Day() != Ref(Day(), -1));
StartBar = ValueWhen(TimeNum() == 093000, BarIndex());
TodayVolume = Sum(V,Bars_so_far_today);
IIf (BarIndex() >= StartBar, VWAP = Sum (C * V, Bars_so_far_today  ) /
TodayVolume,0);
Plot (VWAP,"VWAP",colorRed, styleThick);

_SECTION_END();
1 comments
Leave Comment
Please login here to leave a comment.
nice afl sir gud my ranking 5