EXPERT TREND LOCATOR for Amibroker (AFL)
pipstocks over 13 years ago Amibroker (AFL)
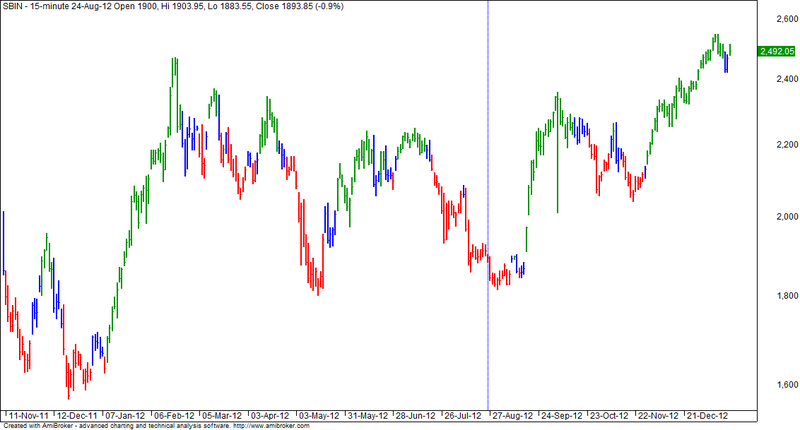
EXPERT TREND LOCATOR like Advanced GET XTL
Screenshots
Indicator / Formula
Copy & Paste Friendly
_SECTION_BEGIN("X T L");

SetChartBkColor(ParamColor("Outer panel color ",colorWhite));
tgt = 37;
a = CCI(20) < -tgt;
b = CCI(20) > tgt;
state = IIf(a>b,-1,IIf(a==b,0,1));
Color = IIf(state == 0, colorBlue, IIf(state == 1, colorGreen, IIf(state == -1, colorRed, 0)));

//Plot(state, "", color, styleHistogram);

SetChartOptions( 0, chartShowDates | chartShowArrows | chartLogarithmic | chartWrapTitle );
_N(Title = StrFormat("{{NAME}} - {{INTERVAL}} {{DATE}} Open %g, Hi %g, Lo %g, Close %g (%.1f%%) {{VALUES}}", O, H, L, C, SelectedValue( ROC( C, 1 ) ) ));
Plot( C, "Close", color, styleNoTitle |styleBar|styleThick);
_SECTION_END();
2 comments
Leave Comment
Please login here to leave a comment.
Is it possible to add the possibility to analyze it, like change of colours, or buy sell signals thanks
It would be nice to have it as a regular histogram. Your histogram doesn’t show the yellow colors and has the same length of sticks.