Stock Portfolio Organizer
The ultimate porfolio management solution.
Shares, Margin, CFD's, Futures and Forex
EOD and Realtime
Dividends and Trust Distributions
And Much More ....
WiseTrader Toolbox
#1 Selling Amibroker Plugin featuring:
Advanced Adaptive Indicators
Advanced Pattern Exploration
Neural Networks
And Much More ....
Shares To Buy Price Graph for Amibroker (AFL)
Rating:
5 / 5 (Votes 1)
Tags:
amibroker, position management
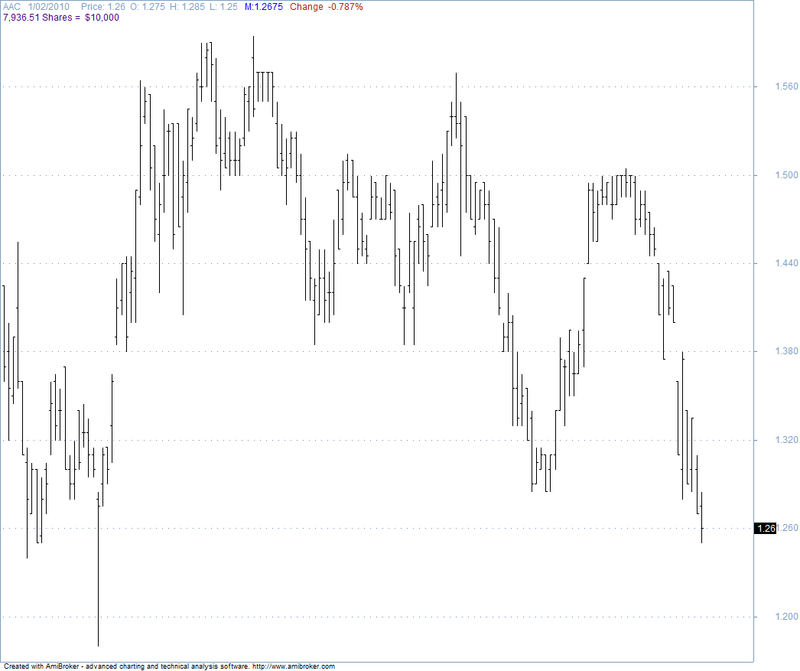
The Shares to Buy Price Graph allows one to automatically see the number of shares that can be purchased based on the current price when the amount of money to be invested is already known. This is useful when using Dollar Weighted Positions such as investing 2000 Dollars in each position. It eliminates the need to drag out a calculator and see how many shares to place for the order. Use the Param Feature – it is Nice.
By Tommy Beard – tab321 [at] yahoo.com
Screenshots
Similar Indicators / Formulas
Kavach Of Karna v2
Submitted
by hbkwarez almost 12 years ago
Advanced Elliott Waves
Submitted
by MarcosEn over 14 years ago
3_6Day GuaiLiLv
Submitted
by motorfly over 14 years ago
Williams Alligator System
Submitted
by durgesh1712 over 14 years ago
Interactive Linear Regression Channel
Submitted
by InternetWorm over 14 years ago
*Level Breakout system*
Submitted
by Tinych over 14 years ago
Indicator / Formula
Copy & Paste Friendly
/*The Shares to Buy Price Graph allows one to automatically see the number of
shares that can be purchased based on the current price when the amount of money
to be invested is already known.  This is useful when using Dollar Weighted
Positions such as investing 2000 Dollars in each position.  It eliminates the
need to drag out a calculator AND see how many shares to place for the order.

Also, if you RIGHT CLICK your graph, you can easily change the Dollar
Parameter by choosing "Parameters" AND sliding the parameter bar.  Parameters
can also be accessed via Ctrl+R on the Keyboard.  The Parameter Bar moves
increments of 100 Dollars but you can type in any figure you desire AND press
"Enter" on your keyboard if you want to use an odd number such as 2846. */

M=10000;//Enter Typical Amount Normally Used for Your Positions and This Figure will become the default Value of the Parameter
SM = Param("SM", M, 1000, 10000, 100 );
MidRange=(H+L)/2;//Figure Used in Title for Middle of Price Range.

Plot(C, "Price", colorBlack, styleBar);

Title = Name() + "   " + Date() + "     Price: " + C + "  O: " + O + "  H: " +
H + "  L: " + L + EncodeColor( colorBlue ) + "   M:" + MidRange + " " +
EncodeColor( colorBrown ) +"  Change"+ WriteVal(ROC( Close, 1) ) + "%" + "\n" +
EncodeColor( colorIndigo ) + WriteVal ( SM/C,(format=1.2)) + " Shares = " + " $"
+ WriteVal ( C*SM/C,(format=1.0));
0 comments
Leave Comment
Please login here to leave a comment.
Back