Thiru-Optimum-Avg for Amibroker (AFL)
tmnkin over 13 years ago Amibroker (AFL)
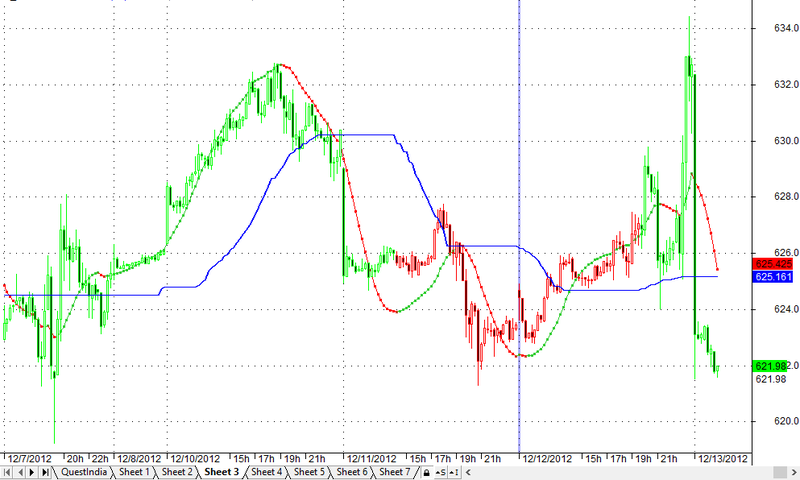
Optimum moving with can be usefull to both sideways and trending market
Screenshots
Indicator / Formula
Copy & Paste Friendly
_SECTION_BEGIN("thiru-optimum-moving");
price = ParamField("field");
n = Param("periods",34);
SA=MA(Price,n);
v1=(StDev(Price,n))^2;

Ca=Null;
Ca[n]=sa[n];

for(i=n+1; i<BarCount;i++){
v2[i]=(CA[i-1]-SA[i])^2;
k[i]=IIf(V2[i]<V1[i],0,1-V1[i]/V2[i]);
CA[i]=CA[i-1]+K[i]*(SA[i-1]-CA[i-1]);
}
Plot(Ca,"OMA("+WriteVal(n,1.0)+")",colorBlue,styleThick);
Col = IIf(BarsSince(Ref(Ca,-1)>Ca)>BarsSince(Ref(Ca,-1)<Ca),colorBrightGreen,colorRed);
Plot(C,"",Col,styleCandle );

_SECTION_END();

////////////////////////////////////////////////////////////////////////////////////
_SECTION_BEGIN( "Chart Settings" );
SetChartOptions( 0, chartShowArrows | chartShowDates  );
//SetChartBkColor( ParamColor( "Outer Panel", colorDarkGrey ) );
//SetChartBkGradientFill( ParamColor( "Upper Chart", colorWhite ), ParamColor( "Lower Chart", colorWhite ) );
_SECTION_END();
Kisa = Param( "KISA GÃœN", 12, 0.1, 500, 0.1 );
Uzun = Param( "UZUN GÃœN", 43, 0.1, 100, 0.1 );
Tetik = Param( "TETI.K GÃœN", 21, 0.1, 50, 0.1 );
_SECTION_BEGIN( "Periodlar" );
function KisaPeriodTopla( Kisa )
{
    ka = Kisa;

    for ( i = 1; i < Kisa; i++ )
    {
        ka = ka + i;
    }

    return ka;
}

function UzunPeriodTopla( Uzun )
{
    au = Uzun;

    for ( iu = 0; iu < Uzun; iu++ )
    {
        au = au + iu;
    }

    return au;
}

function TetikPeriodTopla( Tetik )
{
    a = Tetik;

    for ( i = 0; i < Tetik; i++ )
    {
        a = a + i;
    }

    return a;
}

_SECTION_END();
_SECTION_BEGIN( " Gün Toplamlar?" );
function KisaGunTopla( Kisa )
{
    a = Kisa;
    kd = a * C;

    for ( i = 0;i < Kisa;i++ )
    {
        b = Ref( C, -i );

        if ( a > 0 )
            a--;

        kd = kd + ( a * b );
    }

    return kd;
}

function UzunGunTopla( Uzun )
{
    au = Uzun;
    ku = au * C;

    for ( iu = 0;iu < Uzun;iu++ )
    {
        bu = Ref( C, -iu );

        if ( au > 0 )
            au--;

        ku = ku + ( au * bu );
    }

    return ku;
}

Period12Toplam = KisaPeriodTopla( Kisa );
Day12Toplam = KisaGunTopla( Kisa );
LWMA12 = Day12Toplam / Period12Toplam;
Period43Toplam = UzunPeriodTopla( Uzun );
Day43Toplam = UzunGunTopla( Uzun );
LWMA43 = Day43Toplam / Period43Toplam;
_SECTION_END();

_SECTION_BEGIN( " TSR HESAPLANMASI" );
function XDAY( Tetik )
{
    X = ( ( 2 * LWMA12 ) - LWMA43 );
    aX = Tetik;
    kX = AX * X;

    for ( iX = 0;iX < Tetik;iX++ )
    {
        bX = Ref( X, -iX );

        if ( aX > 0 )
            aX--;

        kX = kX + ( aX * bX );
    }

    return kX;
}

XDayToplam = XDAY( Tetik );
XPeriodToplam = TetikPeriodTopla( Tetik );
TSR = ( XDayToplam / XPeriodToplam );
_SECTION_END();
_SECTION_BEGIN( " EKRANA BASMA I.S,LEMI." );
Plot( C, "Kapanis", colorWhite, styleCandle );
tsrcolor = IIf( TSR > Ref( TSR, -1 ), colorLime, colorRed );
Plot( TSR, "TSR", tsrcolor, styleDots + styleLine );
_SECTION_END();

_SECTION_BEGIN( "EXPLORATION" );
//AL=TSR>Ref(TSR,-1);
//SAT=Ref(TSR,-1)>TSR;
AL = Cross( C, TSR );
SAT = Cross( TSR, C );
AL_status = WriteIf( AL, "Al?s, Yap", " " );
SAT_status = WriteIf( SAT, "Sat?s, Yap", " " );
AL_Col = IIf( AL, colorDarkGreen , colorWhite );
SAT_Col = IIf( SAT, colorRed, colorWhite );
Filter = AL OR SAT;
AddColumn( C, "KAPANIS,", 1.2, IIf( C > Ref( C, -1 ), colorBlue, colorRed ) );
AddTextColumn( AL_status, "TSR ALIS,", 1.2, colorWhite, AL_col );
AddTextColumn( SAT_status, "TSR SATIS,", 1.2, colorWhite, SAT_col );
_SECTION_END();
////////////////////////////////////////////////////////////////////////////////////
5 comments
Leave Comment
Please login here to leave a comment.
simple but effective…thnx a lot
I agree, seems to be effective, but getting “out of range” when running explore.
i am new to afl, will work on few things to improve this indicator
@tmnkin,
i want to use your AFL in my formula…!
can i use this AFL…?
Hi tmnkin,
error in line No. 11
Error 10. Subscript out of range. You must not access array elements outside 0..(BarCount-1) range
appreciate if you can guide me to correct this.
Regards,
Sirisha