HK TREND TRADE for Amibroker (AFL)
amibro69 over 13 years ago Amibroker (AFL)
HK TREND TRADE
FINE TUNED FOR 5 MIN CHART
ENJOY TRADING
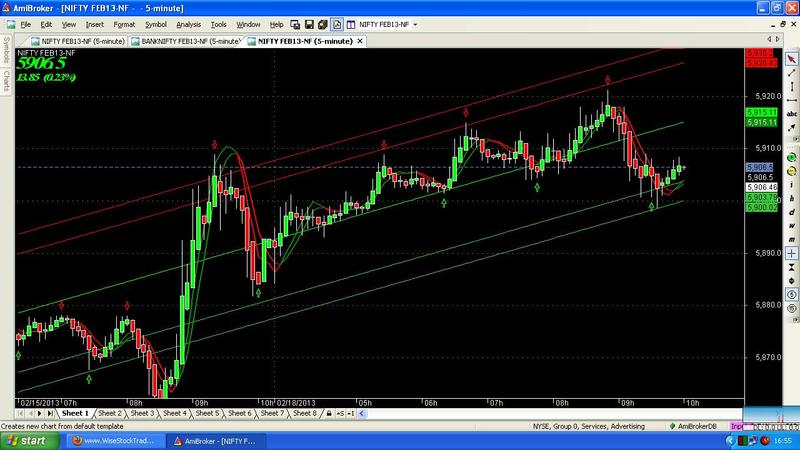
Screenshots
Indicator / Formula
Copy & Paste Friendly
_SECTION_BEGIN("H K  CHART");
//---- TREND TRADE
SetChartOptions(1,chartShowArrows|chartShowDates);
GraphXSpace=5;
HaClose = (O+H+L+C)/4;
HaOpen = AMA( Ref( HaClose, -1 ), 0.8);
HaHigh = Max( H, Max( HaClose, HaOpen ) );
HaLow = Min( L, Min( HaClose, HaOpen ) );
xDiff = (HaHigh - Halow) * IIf(StrFind(Name(),"JPY"),100,10000);
barcolor = IIf(HaClose >= HaOpen,colorWhite,colorWhite);
if( ParamToggle("Plot Heikin-Ashi", "No,Yes", 1 ) )
   PlotOHLC( HaOpen, HaHigh, HaLow, HaClose, "Heikin Ashi " + Name(), colorWhite, styleCandle );
else
 Plot( C, "Regular candles " + Name(), colorWhite, styleCandle );
j=Haclose;

       //PRICE LINE

PriceLineColor = PriceLineColor= colorCustom4;
PriceLevel = C;

Daysback    =  200;
FirstBar    = BarCount - DaysBack;
YY          = IIf(BarIndex() >= Firstbar,EndValue(PriceLevel),Null);

Plot(YY,"Current Price",PriceLineColor,ParamStyle("LineStyle",styleLine|styleDashed|styleNoTitle|styleThick,maskAll));


side = 1;

dist = 0;

for( i = 0; i < BarCount; i++ )
{
 if(i+side== BarCount) PlotText( "\n    " + PriceLevel[ i ], i, YY[ i ]-dist[i], colorCustom2 );
}


_SECTION_END();


_SECTION_BEGIN("Trend Lines");
p1 = Param("TL 1 Periods", 13, 1, 50, 1);
p2 = Param("TL 2 Periods", 3, 1, 25, 1);
TL1 = LinearReg(C, p1);
TL2 = EMA(TL1, p2);
Col1 = IIf(TL1 > TL2, ParamColor("TL Up Colour", colorGreen), ParamColor("TL Dn Colour", colorRed));
Plot(TL1, "TriggerLine 1", Col1, styleLine|styleThick|styleNoLabel);
Plot(TL2, "TriggerLine 2", Col1, styleLine|styleThick|styleNoLabel);
_SECTION_END();


//================================================End Chart Configuration===============================================================================


//====================================Start of Linear Regression Code==================================================================================

P = ParamField("Price field",-1);

Length = 150;

Daysback = Param("Period for Liner Regression Line",Length,1,240,1);
shift = Param("Look back period",0,0,240,1);

//=============================== Math Formula ========================================================================================================

x = Cum(1);
lastx = LastValue( x ) - shift;
aa = LastValue( Ref(LinRegIntercept( p, Daysback), -shift) );
bb = LastValue( Ref(LinRegSlope( p, Daysback ), -shift) );
y = Aa + bb * ( x - (Lastx - DaysBack +1 ) );

//==================Plot the Linear Regression Line ====================================================================================================

LRColor = ParamColor("LR Color", colorCycle );
LRStyle = ParamStyle("LR Style");

LRLine =  IIf( x > (lastx - Daysback) AND BarIndex() < Lastx, y, Null );

LRStyle = ParamStyle("LR Style");
Angle = Param("Angle", 0.05, 0, 1.5, 0.01);// A slope higher than 0.05 radians will turn green, less than -0.05 will turn red and anything in between will be white.

LRLine = IIf( x > (lastx - Daysback) AND BarIndex() < Lastx, y, Null );

Pi = 3.14159265 * atan(1); // Pi
SlopeAngle = atan(bb)*(180/Pi);

LineUp = SlopeAngle > Angle;
LineDn = SlopeAngle < - Angle;

if(LineUp)
{
Plot(LRLine, "Lin. Reg. Line Up", IIf(LineUp, colorBrightGreen, colorWhite), LRStyle);
}
else
{
Plot(LRLine, "Lin. Reg. Line Down", IIf(LineDn, colorDarkRed, colorWhite), LRStyle);
}


//==========================  Plot 1st SD Channel ======================================================================================================

SDP = Param("Standard Deviation", 1.5, 0, 6, 0.1);
SD = SDP/2;

width = LastValue( Ref(SD*StDev(p, Daysback),-shift) ); //Set width of inside chanels here.
SDU = IIf( x > (lastx - Daysback) AND BarIndex() < Lastx, y+width , Null ) ;
SDL = IIf( x > (lastx - Daysback) AND BarIndex() < Lastx, y-width , Null ) ;

SDColor = ParamColor("SD Color", colorCycle );
SDStyle = ParamStyle("SD Style");

Plot( SDU , "Upper Lin Reg", colorRed,SDStyle ); //Inside Regression Lines
Plot( SDL , "Lower Lin Reg", colorLime,SDStyle ); //Inside Regression Lines

//==========================  Plot 2d SD Channel ========================================================================================================

SDP2 = Param("2d Standard Deviation", 2.0, 0, 6, 0.1);
SD2 = SDP2/2;

width2 = LastValue( Ref(SD2*StDev(p, Daysback),-shift) ); //Set width of outside chanels here.
SDU2 = IIf( x > (lastx - Daysback) AND BarIndex() < Lastx, y+width2 , Null ) ;
SDL2 = IIf( x > (lastx - Daysback) AND BarIndex() < Lastx, y-width2 , Null ) ;

SDColor2 = ParamColor("2 SD Color", colorCycle );
SDStyle2 = ParamStyle("2 SD Style");

Plot( SDU2 , "Upper Lin Reg", colorRed,SDStyle2 ); //OutSide Regression Lines
Plot( SDL2 , "Lower Lin Reg", colorLime,SDStyle2 ); //OutSide Regression Lines

Trend = IIf(LRLine > Ref(LRLine,-1),colorGreen,colorRed);//Changes LR line to green if sloping up and red if sloping down.

Plot( LRLine , "LinReg", Trend, LRSTYLE );

//============================ End Indicator Code =========


 /* **********************************

Code to automatically identify pivots

********************************** */

// -- what will be our lookback range for the hh and ll?
farback=Param("How Far back to go",300,50,5000,10);
nBars = Param("Number of bars", 13, 1, 40);

// -- Title.

Title = Name() ;

// -- Plot basic candle chart

PlotOHLC(Open, High, Low, Close,

"BIdx = " + BarIndex() +

"\n" + "O = " + O + "\n"+"H = "+ H + "\n"+"L = " + L

+ "\n"+"C ",

colorBlack, styleBar);

GraphXSpace=7;

// -- Create 0-initialized arrays the size of barcount

aHPivs = H - H;

aLPivs = L - L;

// -- More for future use, not necessary for basic plotting

aHPivHighs = H - H;

aLPivLows = L - L;

aHPivIdxs = H - H;

aLPivIdxs = L - L;

nHPivs = 0;

nLPivs = 0;

lastHPIdx = 0;

lastLPIdx = 0;

lastHPH = 0;

lastLPL = 0;

curPivBarIdx = 0;

// -- looking back from the current bar, how many bars

// back were the hhv and llv values of the previous

// n bars, etc.?

aHHVBars = HHVBars(H, nBars);

aLLVBars = LLVBars(C, nBars);

aHHV = HHV(H, nBars);

aLLV = LLV(L, nBars);

// -- Would like to set this up so pivots are calculated back from

// last visible bar to make it easy to "go back" and see the pivots

// this code would find. However, the first instance of

// _Trace output will show a value of 0

aVisBars = Status("barvisible");

nLastVisBar = LastValue(Highest(IIf(aVisBars, BarIndex(), 0)));

_TRACE("Last visible bar: " + nLastVisBar);

// -- Initialize value of curTrend

curBar = (BarCount-1);

curTrend = "";

if (aLLVBars[curBar] <

aHHVBars[curBar]) {

curTrend = "D";

}

else {

curTrend = "U";

}

// -- Loop through bars. Search for

// entirely array-based approach

// in future version

for (i=0; i<farback; i++) {

curBar = (BarCount - 1) - i;

// -- Have we identified a pivot? If trend is down...

if (aLLVBars[curBar] < aHHVBars[curBar]) {

// ... and had been up, this is a trend change

if (curTrend == "U") {

curTrend = "D";

// -- Capture pivot information

curPivBarIdx = curBar - aLLVBars[curBar];

aLPivs[curPivBarIdx] = 1;

aLPivLows[nLPivs] = L[curPivBarIdx];

aLPivIdxs[nLPivs] = curPivBarIdx;

nLPivs++;

}

// -- or current trend is up

} else {

if (curTrend == "D") {

curTrend = "U";

curPivBarIdx = curBar - aHHVBars[curBar];

aHPivs[curPivBarIdx] = 1;

aHPivHighs[nHPivs] = H[curPivBarIdx];

aHPivIdxs[nHPivs] = curPivBarIdx;

nHPivs++;

}

// -- If curTrend is up...else...

}

// -- loop through bars

}

// -- Basic attempt to add a pivot this logic may have missed

// -- OK, now I want to look at last two pivots. If the most

// recent low pivot is after the last high, I could

// still have a high pivot that I didn't catch

// -- Start at last bar

curBar = (BarCount-1);

candIdx = 0;

candPrc = 0;

lastLPIdx = aLPivIdxs[0];

lastLPL = aLPivLows[0];

lastHPIdx = aHPivIdxs[0];

lastHPH = aHPivHighs[0];

if (lastLPIdx > lastHPIdx) {

// -- Bar and price info for candidate pivot

candIdx = curBar - aHHVBars[curBar];

candPrc = aHHV[curBar];

if (

lastHPH < candPrc AND

candIdx > lastLPIdx AND

candIdx < curBar) {


// -- OK, we'll add this as a pivot...

aHPivs[candIdx] = 1;

// ...and then rearrange elements in the

// pivot information arrays

for (j=0; j<nHPivs; j++) {

aHPivHighs[nHPivs-j] = aHPivHighs[nHPivs-

(j+1)];

aHPivIdxs[nHPivs-j] = aHPivIdxs[nHPivs-(j+1)];

}

aHPivHighs[0] = candPrc ;

aHPivIdxs[0] = candIdx;

nHPivs++;

}

} else {


// -- Bar and price info for candidate pivot

candIdx = curBar - aLLVBars[curBar];

candPrc = aLLV[curBar];

if (

lastLPL > candPrc AND

candIdx > lastHPIdx AND

candIdx < curBar) {


// -- OK, we'll add this as a pivot...

aLPivs[candIdx] = 1;

// ...and then rearrange elements in the

// pivot information arrays

for (j=0; j<nLPivs; j++) {

aLPivLows[nLPivs-j] = aLPivLows[nLPivs-(j+1)];

aLPivIdxs[nLPivs-j] = aLPivIdxs[nLPivs-(j+1)];

}

aLPivLows[0] = candPrc;

aLPivIdxs[0] = candIdx;

nLPivs++;

}

}

// -- Dump inventory of high pivots for debugging

/*

for (k=0; k<nHPivs; k++) {

_TRACE("High pivot no. " + k

+ " at barindex: " + aHPivIdxs[k] + ", "

+ WriteVal(ValueWhen(BarIndex()==aHPivIdxs[k],

DateTime(), 1), formatDateTime)

+ ", " + aHPivHighs[k]);

}

*/

// -- OK, let's plot the pivots using arrows

PlotShapes(

IIf(aHPivs==1, shapeHollowDownArrow, shapeNone), colorRed, 0,

High, Offset=-15);

PlotShapes(

IIf(aLPivs==1, shapeHollowUpArrow , shapeNone), colorBrightGreen, 0,

Low, Offset=-15);
_SECTION_END();


_SECTION_BEGIN("Magnified Market Price");
FS=Param("Font Size",21,11,100,1);
GfxSelectFont("Times New Roman", FS, 700, True );
GfxSetBkMode( colorWhite );
GfxSetTextColor( ParamColor("Color",colorBrightGreen) );
Hor=Param("Horizontal Position",1,1,1200,1);
Ver=Param("Vertical Position",7,1,830,1);
GfxTextOut(""+C, Hor , Ver );
YC=TimeFrameGetPrice("C",inDaily,-1);
DD=Prec(C-YC,2);
xx=Prec((DD/YC)*100,2);
GfxSelectFont("Times New Roman", 12, 700, True );
GfxSetBkMode( colorWhite );
GfxSetTextColor(ParamColor("Color",colorGreen) );
GfxTextOut(""+DD+"  ("+xx+"%)", Hor , Ver+30 );
GraphXSpace=-5;
_SECTION_END();
12 comments
Leave Comment
Please login here to leave a comment.
Dear Admin – Does this look into the future?
In parameters change the number of bars from 13 to 11 with 5 min chart
Its Giving error in Ami 5.60
if (aLLVBars[curBar] < aHHVBars[curBar]) {
superb indicator, thanks for it and my 5 votes to it.
I am new comer I required more this type AFL
Please contact me email:nagartrilok@gmail.com
This look into the future. Do not trade on this other wise you make loss only….
Plz do not allow this type of indicator thats change always theit buy & sell signals..
So, who can tell us for sure if this is a “back to the future” afl???
Hi
@ robhoot
There is a simple way to know if the indicator looks into the future.
in Ami, run Bar Replay and select the start, end and step interval of ur choice and play.
For non-repainting indicators the buy/sell arrows do not change as the bars advance. If they change and repaint, then the indicator looks into the future.
-sd
Thanks a lot SD! I really appreciate your response and explanation. I followed your advice and found out that this afl indeed looks into the future…
Hello i relaly lov ethis afl..amazing..but i need help can you add nuy and sell with target in this indicator. that will be amazing.
Hello i relaly love this afl..amazing..but i need help can you add nuy and sell with target in this indicator. that will be amazing.
Even I am also getting below error. Plz suggest / help
Its Giving error in Ami 5.60
if (aLLVBars[curBar] < aHHVBars[curBar]) {