KPBB htrsystem for Amibroker (AFL)
jaipal7786 over 13 years ago Amibroker (AFL)
kp band advance fully utilized…..enjoy
little bit heavy…
no need plugins…
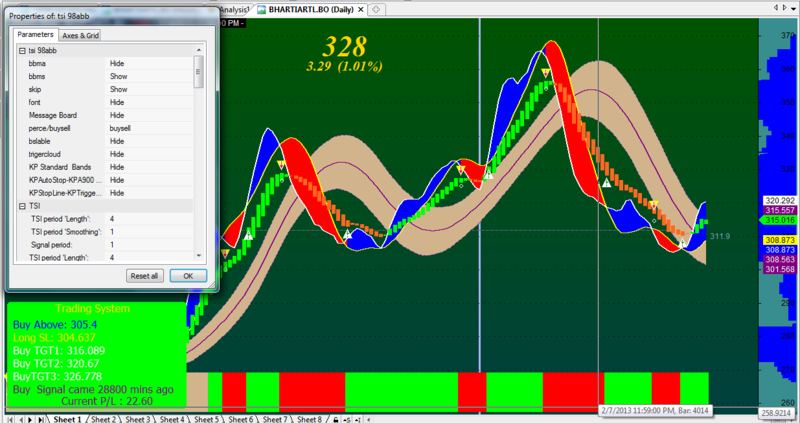
Screenshots
Indicator / Formula
Copy & Paste Friendly
bbm = ParamToggle("bbma","Show|Hide",1);
bbms = ParamToggle("bbms","Show|Hide",0);
skip = ParamToggle("skip","Show|Hide",0);
font = ParamToggle("font","Show|Hide",1);
messageboard = ParamToggle("Message Board","Show|Hide",1);
prexplore= ParamToggle("perce/buysell","pers|buysell",1);
bslable= ParamToggle("bslable","Show|Hide",1);
trigercloud=ParamToggle("trigercloud","Show|Hide",1);
Dispa=ParamToggle("KP Standard  Bands","Show|Hide",1);
Disp2=ParamToggle("KPAutoStop-KPA900 Trend","Show|Hide",1);
Disp3=ParamToggle("KPStopLine-KPTriggerLine","Show|Hide",1);
_SECTION_BEGIN ("TSI");
r = Param ("TSI period 'Length':", 4, 1, 100, 1);
s = Param ("TSI period 'Smoothing':", 18, 1, 100, 1 );
u = Param ("TSI period 'Smoothinga':", 16, 1, 100, 1);
sig = Param ("Signal period:", 6, 1, 100, 1);
Mtm = C - Ref (C , -1);
AbsMtm = abs (Mtm);
 Num_T = EMA (EMA (EMA (Mtm, r), s), u);
Den_T = EMA (EMA (EMA (AbsMtm, r), s), u);
TSI = 500 * Nz (Num_T / Den_T);
Tsicolor = IIf (tsi> Ref (tsi, -1), colorBrightGreen, colorRed);
//Show_color = ParamToggle("Display CandleColor", "No|Yes", 1);
Smooth11=Param("Smooth11",3,2,100,1);
Smooth21=Param("Smooth21",5,2,100,1);
Smooth31=Param("Smooth31",8,2,100,1);
Smooth41=Param("Smooth41",18,2,100,1);
Smooth51=Param("Smooth51",11,2,100,1);
Smooth61=Param("Smooth61",11,2,100,1);
x1=EMA(C,Smooth11);
y1=MA(C,Smooth21);
z1=MA(C,Smooth51);
E_TSKPUPSELL=TSF(z1,Smooth61);

E_TSKPA900=TSF(x1,Smooth31);

tskp_triggerline=TSF(y1,Smooth41);
//P = ParamField("Price field",-1);
//Smooth1=Param("Smooth1",3,2,100,1);
//Smooth2=Param("Smooth2",5,2,100,1);
Smooth3=Param("Smooth3",10,2,100,1);
Smooth4=Param("Smooth4",11,2,100,1);


Var1=E_TSKPA900;

Var2=tskp_triggerline;
Colora=IIf(Var1 >Var2,colorBlue,colorRed);
Colorb=IIf(Var1 >Var2,colorBrightGreen,colorRed);
_SECTION_BEGIN("KPAutoStop-KPA900 Trend");

//parmASStyle = ParamStyle("AutopStop Style", styleDots | styleThick, maskAll);
//parmASColor = ParamColor("AutoStop Color", colorYellow);
parmPA900Style = ParamStyle("KP A900 Style", styleLine | styleThick, maskAll);
parmPA900Color = ParamColor("KP A900 Color", colorWhite);

if(skip==1){
 PlotGrid ( 200 , colorLightGrey );
PlotGrid (- 200 , colorLightGrey );
Plot (TSI, "TSI (" + r + "," + s + "," + u + ")", Tsicolor, ParamStyle ("Style") | styleThick +8);
Plot (EMA (TSI, sig), "", ParamColor ("color", colorYellow), styleLine | styleThick +8);
Plot (0, "", colorWhite, styleLine | styleThick); PlotGrid (200, colorLightGrey);
//PlotGrid (-200,   TSI,-15);
_SECTION_END ();
}else{


//---- heikin ashi
py = Param("pc", 9, 0, 100,1 );
HaClose = (EMA(O,py)+EMA(H,py)+EMA(L,py)+EMA(C,py))/4;
HaOpen = AMA( Ref( HaClose, -1 ), 0.5 );
HaHigh = Max( H, Max( HaClose, HaOpen ) );
HaLow = Min( L, Min( HaClose, HaOpen ) );
xDiff = (HaHigh - Halow) * IIf(StrFind(Name(),"JPY"),100,10000);
barcolor = IIf(HaClose >= HaOpen,colorBrightGreen,colorOrange);
PlotOHLC( HaOpen, Haopen, Haclose, HaClose, "", barcolor, styleCandle );
// Plot(EMA(HaClose,9),"",colorWhite, styleLine);
// Plot(EMA(HaClose,18),"",colorBlack, styleLine);


if(bbm==0){
_SECTION_BEGIN("MA1");
P = ParamField("Price field",-1);
Periods = Param("Periods", 12, 2, 200, 1, 1 );
bb=MA( P, Periods );
bbcolor = IIf (Avg> Ref (bb, -1), colorWhite, colorRed);
Plot( bb, _DEFAULT_NAME(),bbcolor ,ParamStyle("Style") );
_SECTION_END();
_SECTION_BEGIN("Bollinger Bands");
P = ParamField("Price field",-1);
Periods = Param("Periods", 15, 2, 100, 1 );
Width = Param("Width", 2, 0, 10, 0.05 );
//Color = ParamColor("Color", colorCycle );
bbcolor1 = IIf (Avg> Ref (bb, -1), colorBrightGreen, colorRed);
Style = ParamStyle("Style");
Plot( BBandTop( P, Periods, Width ), "BBTop" + _PARAM_VALUES(), bbcolor1, Style );

Plot( BBandBot( P, Periods, Width ), "BBBot" + _PARAM_VALUES(), bbcolor1, Style );

_SECTION_END();}
//Buy=Cover=(Cross(Tsicolor==colorBrightGreen,Tsicolor==colorRed));
//Sell=Short=(Cross(Tsicolor==colorRed,Tsicolor==colorBrightGreen));

//Cover=Buy;
//Short=Sell;

if(bbms==0){

if(Disp2==1){
//Plot( E_TSKPAUTOSTOP(High,Low,Close) ,"KP AutoStop",parmASColor, parmASStyle);
Plot( E_TSKPA900 , "KP A900", parmPA900Color, parmPA900Style);}
_SECTION_END();

_SECTION_BEGIN("KPStopLine-KPTriggerLine");

//parmSLStyle = ParamStyle("KPStopLine Style", styleLine | styleThick, maskAll);
//parmSLColor = ParamColor("KPStopLine Color", colorRed);
parmTLStyle = ParamStyle("KPTriggerLine Style", styleLine | styleThick, maskAll);
parmTLColor = ParamColor("KPTriggerLine Color", colorYellow);
sw = E_TSKPUPSELL;
if(Disp3){
//Plot( E_TSKPSTOPLINE(High,Low,Close) , "KPStopLine", parmSLColor,parmSLStyle );
Plot( tskp_triggerline, "KPTriggerLine", parmTLColor,parmTLStyle ); }
_SECTION_END();

_SECTION_BEGIN("KP Trigger Cloud");

if(trigercloud==1){
PlotOHLC(Var1,Var1,Var2,Var2,"Cloud",Colora,styleCloud);}
_SECTION_END();
}
_SECTION_BEGIN("KP Standard Error Bands");
//Disp12=ParamToggle("KP Standard Error Bands","Show|Hide",1);
Periods=Param("Standard Error",30,3,200,1);
Smooth=Param("Smooth",20,2,100,1);

LRCurve=LinearReg( C, periods );
MALRCurve=MA(LRCurve, Smooth);
SEValue=StdErr( C, periods );
SErrorAvg=MA(SEValue, Smooth);

LowerBand= MALRCurve - SErrorAvg ;
UpperBand= MALRCurve + SErrorAvg ;

Plot(MALRCurve,"MidBand",ParamColor("ColorMB",colorViolet),ParamStyle("StyleMB",styleLine|styleThick));
Plot(UpperBand,"UpperBand",ParamColor("ColorUp",colorViolet),ParamStyle("StyleUp",styleDashed,maskDefault));
Plot(LowerBand,"LowerBand",ParamColor("ColorLo",colorViolet),ParamStyle("StyleLow",styleDashed,maskDefault));
if(Dispa==1){
PlotOHLC( UpperBand,UpperBand,LowerBand,LowerBand,"Band",ParamColor( "Color", colorTan ),styleCloud|styleNoLabel);
}
_SECTION_BEGIN("Price Line");

PriceLineColor=ParamColor("PriceLineColor",ColorRGB(82,82,82));
PriceLevel = ParamField("PriceField", field = 3 );

Daysback    = Param("Bars Back",100,10,500,1);
FirstBar    = BarCount - DaysBack;
YY          = IIf(BarIndex() >= Firstbar,EndValue(PriceLevel),Null);

Plot(YY,"Current Price",PriceLineColor,ParamStyle("LineStyle",styleLine|styleDashed|styleNoTitle|styleNoLabel|styleThick,maskAll));


side = Param("side",1,0,1000,1);

dist = 0;

for( i = 0; i < BarCount; i++ )
{
 if(i+side== BarCount) PlotText( "\n    " + PriceLevel[ i ], i, YY[ i ]-dist[i], colorLightBlue );
}


_SECTION_END();
_SECTION_END();
}


_SECTION_BEGIN("KP TrendBias BackGround");//Plot Tone
dummy =  Var1;
KPTB = Var2;
KPTBSlow = MA(Var1,Var2);
parmToneColorUp= Colorb ;
parmToneColorDn=ParamColor("Tone Color Dn", colorTan);
RibbonSize=Param("Ribbon Size",1,0.5,10,0.5);
Plot( RibbonSize,"Tone",IIf(KPTB > KPTBSlow,parmToneColorUp,parmToneColorDn),styleOwnScale|styleArea|styleNoLabel,0,10);
Buy=Cover=(Cross(E_TSKPA900,tskp_triggerline));
Sell=Short=(Cross(tskp_triggerline,E_TSKPA900));

Cover=Buy;
Short=Sell;

if(font==0)
{
_SECTION_BEGIN("Name");
GfxSetOverlayMode(0);
GfxSelectFont("Tahoma", Status("pxheight")/8 );
GfxSetTextAlign( 6 );// center alignment
GfxSetTextColor( ColorHSB( 42, 42, 42 ) );
GfxSetBkMode(0); // transparent
GfxTextOut( Name(), Status("pxwidth")/2, Status("pxheight")/12 );
GfxSelectFont("Tahoma", Status("pxheight")/18 );
GfxTextOut("" , Status("pxwidth")/2, Status("pxheight")/4 );
GfxSelectFont("Tahoma", Status("pxheight")/18 );
GfxSelectFont("Tahoma", Status("pxheight")/36 );
GfxTextOut( "", Status("pxwidth")/2, Status("pxheight")/3 );
_SECTION_END();

//Magfied Market Price
GfxSetTextAlign( 6 );// center alignment
FS=Param("Font Size",72,11,100,1);
GfxSelectFont("Times New Roman", FS, 700, True );
GfxSetBkMode(0); // transparent
GfxSetTextColor( ColorHSB( 42, 42, 42 ) );
Hor=Param("Horizonta Position",615,1,1200,1);
Ver=Param("Vertica Position",152,1,830,1);
GfxTextOut(""+C, Hor , Ver );
YC=TimeFrameGetPrice("C",inDaily,-1);
DD=Prec(C-YC,2);
GfxSetTextAlign( 6 );// center alignment
xx=Prec((DD/YC)*100,2);
FS2=Param("Font Size2",35,11,100,1);
GfxSelectFont("Times New Roman", FS2,11, 700, True );
GfxSetBkMode( colorBlack );
Hor1=Param("Horizontal Position",615,1,1200,1);
Ver1=Param("Vertical Position",188,1,830,1);
GfxSetTextColor( ColorHSB( 42, 42, 42 ) );
GfxTextOut(""+DD+"  ("+xx+"%)", Hor1 , Ver1+45 );
}
else
{{
//Magfied Market Price
GfxSetTextAlign( 6 );// center alignment
fse=Param("Font Sizee",35,11,100,1);
GfxSelectFont("Times New Roman", fse, 700, True );
GfxSetBkMode( colorGold );
GfxSetTextColor( ParamColor("Color",colorGold) );
Hora=Param("Horizontal Positiona",525,1,1200,1);
Vera=Param("Vertical Positiona",17,1,830,1);
GfxTextOut(""+C, Hora , Vera );
YCa=TimeFrameGetPrice("C",inDaily,-1);
DDa=Prec(C-YCa,2);
GfxSetTextAlign( 6 );// center alignment
xxa=Prec((DDa/YCa)*100,2);
FSb=Param("Font Sizeb",16,11,100,1);
GfxSelectFont("Times New Roman",fsb, 700, True );
GfxSetBkMode( colorBlack );
GfxSetTextColor(ParamColor("Color",colorYellow) );
GfxTextOut(""+DDa+"  ("+xxa+"%)", Hora , Vera+45 );
 _SECTION_END();
}}


PlotShapes( Buy * shapeUpArrow + Sell * shapeDownArrow, IIf( Buy, colorWhite, colorYellow ) );
PlotShapes( Buy * shapeUpTriangle + Sell * shapeDownTriangle, IIf( Buy, colorWhite, colorYellow ) );
PlotShapes( Buy * shapeHollowSmallCircle + Sell * shapeHollowSmallCircle, IIf( Buy, colorWhite, colorYellow ));
PlotShapes(IIf(Buy,shapeUpArrow,shapeNone),colorGreen);
PlotShapes(IIf(Buy,shapeHollowUpArrow,shapeNone),colorWhite);
PlotShapes(IIf(Buy,shapeHollowSmallCircle,shapeNone),colorWhite);

PlotShapes(IIf(Sell,shapeDownArrow,shapeNone),colorRed);
PlotShapes(IIf(Sell,shapeHollowDownArrow,shapeNone),colorWhite);
PlotShapes(IIf(Sell,shapeHollowSmallCircle,shapeNone),colorWhite);


Buy=ExRem(Buy,Sell);
Sell=ExRem(Sell,Buy);
AlertIf( Buy, "", "BUY @ " + C, 1 );
AlertIf( Sell, "", "SELL @ " + C, 2 );
no=Param( "Swing", 8, 1, 55 );
tsl_col=ParamColor( "Color", colorLightGrey );
res=HHV(H,no);
sup=LLV(L,no);
avd=IIf(C>Ref(res,-1),1,IIf(C<Ref(sup,-1),-1,0));
avn=ValueWhen(avd!=0,avd,1);
tsl=IIf(avn==1,sup,res);

no =  Optimize("TSL",Param("A (Change To Optimise)",10, 1, 55 ,1),1, 55 ,1);

tsl_col=ParamColor( "Color", colorLightGrey );
res=HHV(H,no);
sup=LLV(L,no);
avd=IIf(C>Ref(res,-1),1,IIf(C<Ref(sup,-1),-1,0));
avn=ValueWhen(avd!=0,avd,1);
dtsl=IIf(avn==1,sup,res);
SellPrice=ValueWhen(Short,C,1);
BuyPrice=ValueWhen(Buy,C,1);
Long=Flip(Buy,Sell);
Shrt=Flip(Short,Cover);
Relax = NOT Long AND NOT Buy AND NOT shrt AND NOT Sell AND NOT Sell AND NOT Cover;
SellSL=ValueWhen(Short,DTSL,1);
BuySL=ValueWhen(Buy,DTSL,1);
BuyDifference= BuyPrice - BuySL;
SellDifference = SellSL - SellPrice;

tar1 = IIf(Buy OR Long AND NOT Relax AND NOT Sell AND NOT Cover, (BuyPrice + BuyDifference), (SellPrice - SellDifference));
tar2 = IIf(Buy OR Long AND NOT Relax AND NOT Sell AND NOT Cover, (BuyPrice + (2*BuyDifference)), (SellPrice - (2*SellDifference)));
tar3 = IIf(Buy OR Long AND NOT Relax AND NOT Sell AND NOT Cover, (BuyPrice + (4*BuyDifference)), (SellPrice - (4*SellDifference)));


CloseAtEnd = ParamToggle("Close Positions EOD", "No|Yes");
stopreverse =ParamToggle("Switch To Stop And Reverse","No|Yes",0);
Trend = ATR(21) < StDev (C,21);
Range = ATR(21) > StDev (C,21);
no=10;
C13=20;
C14=2.1;
C15=12;

tsl_col=ParamColor( "Color", colorLightGrey );
res=HHV(H,no);
sup=LLV(L,no);
avd=IIf(C>Ref(res,-1),1,IIf(C<Ref(sup,-1),-1,0));
avn=ValueWhen(avd!=0,avd,1);
dtsl=IIf(avd==1,sup,res);

SellPrice=ValueWhen(Short,C,1);
BuyPrice=ValueWhen(Buy,C,1);
Long=Flip(Buy,Sell);
Shrt=Flip(Short,Cover);
Relax = NOT Long AND NOT Buy AND NOT shrt AND NOT Sell AND NOT Sell AND NOT Cover;
SellSL=ValueWhen(Short,DTSL,1);
BuySL=ValueWhen(Buy,DTSL,1);
BuyDifference= BuyPrice - BuySL;
SellDifference = SellSL - SellPrice;

//tar1 = IIf(Buy OR Long AND NOT Relax AND NOT Sell AND NOT Cover, (BuyPrice + BuyDifference), (SellPrice - SellDifference));
//tar2 = IIf(Buy OR Long AND NOT Relax AND NOT Sell AND NOT Cover, (BuyPrice + (2*BuyDifference)), (SellPrice - (2*SellDifference)));
//tar3 = IIf(Buy OR Long AND NOT Relax AND NOT Sell AND NOT Cover, (BuyPrice + (4*BuyDifference)), (SellPrice - (4*SellDifference)));
buyach1 = IIf((Buy OR Long AND NOT Relax AND NOT Cover AND NOT Short AND NOT Shrt), H > tar1, 0);
buyach2 = IIf((Buy OR Long AND NOT Relax AND NOT Cover AND NOT Short AND NOT Shrt), H > tar2 , 0);
buyach3 = IIf((Buy OR Long AND NOT Relax AND NOT Cover AND NOT Short AND NOT Shrt), H > tar3, 0);

sellach1 = IIf((Short OR Shrt AND NOT Relax AND NOT Sell AND NOT Buy AND NOT Long), L < tar1 , 0);
sellach2 = IIf((Short OR Shrt AND NOT Relax AND NOT Sell AND NOT Buy AND NOT Long), L < tar2, 0);
sellach3 = IIf((Short OR Shrt AND NOT Relax AND NOT Sell AND NOT Buy AND NOT Long), L < tar3, 0);


// User-defined parameter for EMA periods

EMA_Type		= Param("EMA-1, TEMA-2, JMA-3", 2, 1, 3, 1);
EMA_prds 		= Param("EMA_periods", 7, 1, 30, 1);
Std_MACD		= Param("Standard MACD? No-0, Yes-1", 1, 0, 1, 1);
Plot_fashion	= Param("Bar+Arrows-1, Impulse  Bars-2", 2, 1, 2, 1);


// Allow user to define Weekly and Monthly Ribbon Location and Height
WR_P1 = Param("Weekly Ribbon Location", -10.5, -1000, 1000, 0.1);
WR_P2 = Param("Weekly Ribbon Height", 366.5, -0.001, 500, 0.1);

MR_P1 = Param("Monthly Ribbon Location", 5.2, -1000, 1000, 0.1);
MR_P2 = Param("Monthly Ribbon Height", 199, -0.001, 500, 0.1);


// Compute EMA and MACD Histogram
if(EMA_Type == 1)
{
	DayEMA	= EMA(Close, EMA_prds);
}
if (EMA_Type == 2)
{
	DayEMA	= TEMA(Close, EMA_prds);
}

if(EMA_Type == 3)
{
	// Line below to be used with Jurik JMA
	// DayEMA = JurikJMA(C, EMA_Prds);
}

Histogram	= MACD() - Signal();

// Determine if we have an Impulse UP, DOWN or None
Impulse_Up		=	DayEMA > Ref(DayEMA, -1) AND Histogram > Ref(Histogram, -1);
Impulse_Down	=	DayEMA < Ref(DayEMA, -1) AND Histogram < Ref(Histogram, -1);
Impulse_None		=	(NOT Impulse_UP) AND (NOT Impulse_Down);

// Compute Weekly MACD and determine whether rising or falling
// Note: uses "non-standard"  parameters!
TimeFrameSet(inWeekly);

if (Std_MACD == 0)
{
MACD_val		=	MACD(5, 8);
Signal_val		=	Signal(5, 8, 5);
}
else
{
MACD_val		=	MACD(12, 26);
Signal_val		=	Signal(12, 26, 9);
}

Hist_in_w		=	MACD_val - Signal_val;

wh_rising = Hist_in_w > Ref(Hist_in_w, -1);
wh_falling = Hist_in_w < Ref(Hist_in_w, -1);

TimeFrameRestore();

// Now get Monthly MACD Histogram....
TimeFrameSet(inMonthly);
MACD_val		=	MACD(5, 8);
Signal_val		=	Signal(5, 8, 5);
Hist_in_m		=	MACD_val - Signal_val;

mh_rising = Hist_in_m > Ref(Hist_in_m, -1);
mh_falling = Hist_in_m < Ref(Hist_in_m, -1);

TimeFrameRestore();

wh_rising 		= TimeFrameExpand( wh_rising, inWeekly, expandLast );
wh_falling 		= TimeFrameExpand( wh_falling, inWeekly, expandLast);
mh_rising 	= TimeFrameExpand(mh_rising, inMonthly, expandLast);
mh_falling 	= TimeFrameExpand(mh_falling, inMonthly, expandLast);

kol 	= IIf( wh_rising, colorGreen,  IIf(wh_falling, colorRed,
colorLightGrey));
mkol 	= IIf( mh_rising, colorBlue,  IIf(mh_falling, colorYellow,
colorLightGrey));

// Plot them all!
if (Plot_fashion == 1)
{
	Plot(Close, "Close", colorTeal, styleBar);
	PlotShapes(shapeUpArrow * Impulse_Up, colorBlue, 0, Low, -12);
	PlotShapes(shapeDownArrow * Impulse_Down, colorRed, 0, High, -12);
	PlotShapes(shapeSmallCircle * Impulse_None, colorWhite, 0, High, 5);
}
else
{
	bar_kol	=	IIf(impulse_UP, colorBlue, IIf(impulse_Down, colorRed,
colorWhite));
	//Plot(C, "Close", bar_kol, styleBar);
}

Plot(10, "ribbon", kol, styleOwnScale|styleArea|styleNoLabel, WR_P1, WR_P2);//Weekly trend

Plot(10, "ribbon", mkol, styleOwnScale|styleArea|styleNoLabel, MR_P1,
MR_P2);	// Monthly Trend

// Explorer Section
// Determine if Impulse status is bullish, neutral or bearish.  Display as Text Column.

Impulse_State		=	WriteIf(Impulse_Up, "Bul", WriteIf(Impulse_Down,
"Bear", "Neut"));

// Set the background color for Impulse Status Column
Impulse_Col		=	IIf(Impulse_Up, colorGreen, IIf(Impulse_Down, colorRed,
colorLightGrey));

// Determine Weekly Trend. Display as Text Column
Weekly_Trend		=	WriteIf(wh_rising, "Rising", WriteIf(wh_falling, "Falling",
"Flat!"));
Weekly_Col		=	IIf(wh_rising, colorGreen, IIf(wh_falling, colorRed,
colorLightGrey));

// Determine Monthly Trend. Display as Text Column
Monthly_Trend	=	WriteIf(mh_rising, "Rising", WriteIf(mh_falling, "Falling",
"Flat!"));
Monthly_Col		=	IIf(mh_rising, colorGreen, IIf(mh_falling, colorRed,
colorLightGrey));

// Determine how many bars has the current state existed
bars_in_bull	=	Min(BarsSince(impulse_none), BarsSince(impulse_down));
bars_in_bear	=	Min(BarsSince(impulse_up), BarsSince(impulse_none));
bars_in_neut	=	Min(BarsSince(impulse_down), BarsSince(impulse_up));

// Set a single variable to show number of bars in current state depending upon

// actual Impulse Status - Bullish, Bearish or Neutral
bars_in_state	=	IIf(Impulse_Up,bars_in_bull, IIf(Impulse_down, bars_in_bear,bars_in_neut));
//AddColumn(Close,"Close",1.2);
// Columns for display in Explorer
//AddTextColumn(Impulse_State, "Status", 1, colorWhite, Impulse_Col);
//AddColumn(bars_in_state, "Bars", 1, colorWhite, Impulse_col);
//Action = WriteIf(Buy, "BUY", WriteIf(Sell, "SELL", "   "));
//i=0;
//bars_in_statee	=	IIf(Buy, BarCount[i], IIf(Sell, BarCount[i],bars_in_neut));
//bars=BarsSince(IIf(Buy+BarCount+1),OR( Sell-BarCount+1));

plus= Param("plus", 0.8,0,52,1);
Minus = Param("Minus", -0.8,-15,-0,-20);
prch = (C- TimeFrameGetPrice( "C", inDaily, -1 ))/ TimeFrameGetPrice( "C", inDaily, -1 )*100 ;
prcha= (C-Ref(C,-6))/Ref(C,-6)*100;
prche= (C-Ref(C,-2))/Ref(C,-1)*100;
prchjk= (C-Ref(C,-2))+Ref(C,-1)*10/1;
//prchjka=(prchjk)/10;

prchjka = (C+ TimeFrameGetPrice( "C", inDaily, -1 ))- Close;

//Date()
//prchjk= (Date()-Ref(Date(),-1))+Ref(Date(),-1);
prch5=(prche-prch);
prch6= (C-Ref(C,-5))/Ref(C,-5)*100;
prch7= (C-Ref(C,-29))/Ref(C,-29)*100;
prch8= (C-Ref(C,-87))/Ref(C,-87)*100;
prch9= (C-Ref(C,-150))/Ref(C,-150)*100;
prch10= (C-Ref(C,-254))/Ref(C,-252)*100;
prch11= (C-Ref(C,-490))/Ref(C,-490)*100;
prch12= (C-Ref(C,-735))/Ref(C,-735)*100;
prch13= (C-Ref(C,-1283))/Ref(C,-1283)*100;


col=IIf ((Volume > 1.25 * EMA( Volume, 34 )),colorRed,colorLime);
//Col=IIf(( Buy, 66 , 83 ),  formatChar, colorDefault, IIf( plus , colorGreen, colorRed ));

//Filter = prch6 <3 OR prch6  <-3 ;
if(prexplore==0)
{Filter = prch > plus OR prch  < Minus  ;
AddColumn(prchjka ,"prvClose",colorDefault,Col,colorPlum);
AddColumn(Close,"Close",1.2,colorDefault, Col);
AddColumn(prch5,"prviday", 1.2,colorDefault, Col);
AddColumn(prch,"daily", 1.2,colorDefault, Col);
//Filter=0;
AddColumn( IIf( Buy, 66 , 83 ), "Signal", formatChar, colorDefault, IIf( Buy , colorGreen, colorRed ) );

AddColumn(Volume,"Volume",1.0, colorDefault, IIf ((Volume > 1.25 * EMA( Volume, 34 )),colorCustom12,colorLime));
AddColumn(prch6,"weekly", 1.2,colorDefault, Col);
AddColumn(prch7,"monthly", 1.2,colorDefault, Col);
AddColumn(prch8,"qutrly", 1.2,colorDefault, Col);
AddColumn(prch9,"halfyly", 1.2,colorDefault, Col);
AddColumn(prch10,"yearly", 1.2,colorDefault, Col);
AddColumn(prch11,"twoyrly", 1.2,colorDefault, Col);
AddColumn(prch12,"thirdyrly", 1.2,colorDefault, Col);
AddColumn(prch13,"fiveyrly", 1.2,colorDefault, Col);

}
else
{

//Filter =  Sell>-2 AND i<-3 OR Buy>2 AND i<3 ;
AddColumn(ROC(V,1),"RVol ",1.2, IIf(ROC(V,1) > 0,colorDefault,colorYellow),Impulse_col);

AddColumn(bars_in_state ,"Bars", 1, colorWhite, Impulse_col);
prchjka = (C+ TimeFrameGetPrice( "C", inDaily, -1 ))- Close;

//AddColumn(C + C +1 ,"Close",1.2,colorDefault, Col)/2;
AddColumn(prchjka ,"prvClose",colorDefault,colorWhite, colorBlue);
//AddTextColumn(Weekly_Trend, "W Trend", 1, colorWhite, Weekly_Col);
//AddTextColumn(Monthly_Trend, "M Trend", 1, colorWhite, Monthly_Col);

//Filter = 1;

_SECTION_END();
//Settings for exploration

H1 = SelectedValue( TimeFrameGetPrice( "H", inDaily, -1 ) );
L1 = SelectedValue( TimeFrameGetPrice( "L", inDaily, -1 ) );
C1 = SelectedValue( TimeFrameGetPrice( "C", inDaily, -1 ) );
H2 = SelectedValue( TimeFrameGetPrice( "H", inDaily, 0 ) );
L2 = SelectedValue( TimeFrameGetPrice( "L", inDaily, 0 ) );
O1 = SelectedValue( TimeFrameGetPrice( "open", inDaily, 0 ) );
F4 = 0;
D1 = ( H1 - L1 );
D2 = ( H2 - L2 );
F1 = D1 * 0.433;
F2 = D1 * 0.766;
F3 = D1 * 1.35;
if ( D2 <= F1 )
    F4 = F1;
else
    if ( D2 <= F2  )
        F4 = F2;
    else
        F4 = F3;

S_P = ( O1 - F4 );

B_P = ( O1 + F4 );

BP = ( L2 + F4 );

BPTGT = ( BP + ( BP * .0065 ) );//.0015 brokerage

BPSTPLS = ( BP - ( BP * .0085 ) );

SP = ( H2 - F4 );

SPTGT = ( SP - ( SP * .0065 ) );

SPSTPLS = ( SP + ( SP * .0085 ) );


p = ( H1 + L1 + C1 ) / 3;

s1 = ( H1 );

r1 = ( L1 );

r2 = SelectedValue( L2 );

s2 = SelectedValue( H2 );

//CONDITION

if (ParamToggle("Tooltip shows", "All Values|Only Prices"))
{
  ToolTip = StrFormat("Open: %g\nHigh:  %g\nLow:   %g\nClose:  %g (%.1f%%) \nVolume: " + NumToStr(V, 1), O, H, L, C, SelectedValue(ROC(C, 1)));
}

//space = Param("Space on Chart", 20,  - 15, 50, 1);
//GraphXSpace = space;
//SetChartBkColor(ParamColor("Background Color", colorBlack));

// ================= Rasheed's original code (with Lookback and Shift default set to his specs) =================

H0 = H;
L0 = L;
C0 = C;
O0 = O;

Lookback = Param("LookBack", 10, 10, 50, 1); // Default for interday commodity currency trading
shift = Param("Shift", 5, 1, 50, 1); // ?
x0 = LastValue(Cum(1));
x1 = x0 - shift;
H = Ref(H,  - shift + 1);
L = Ref(L,  - shift + 1);
H1 = LastValue(Ref(HHV(H, Lookback),  - 1));
L1 = LastValue(Ref(LLV(L, Lookback),  - 1));

//Plot(H1, "H1", colorYellow);
//Plot(L1, "L1", colorYellow);

H = H0;
L = L0;
C = C0;
O = O0;

up = Cross(H, H1)AND Cum(1) > x1;
dn = Cross(L1, L)AND Cum(1) > x1;

//Plot(C, "Close", IIf(Cum(1) > x1 - Lookback AND Cum(1) <= x1, colorBlue, IIf(Up, colorBrightGreen, IIf(Dn, colorRed, IIf(C > O, colorGreen, colorRed)))), 64);
//PlotShapes(shapeDownArrow *(Cum(1) == x1 + 1), colorBlue);

// ======================= Exploration and Signal Code =================
TRIGGER = ParamToggle("Trigger ", "CLOSE|HIGH OR LOW");


XH1 = Cross(C, H1);
XL1 = Cross(L1, C);
XH2 = Cross(H, H1);
XL2 = Cross(L1, L);

if (TRIGGER == 0)
{
  //Buy = XH1;
  //Sell = XL1;
}

else
{
  //Buy = XH2;
  //Sell = XL2;
}


//TradeDisplay = ParamToggle("Remove Extra Trades?", "No|Yes");

//if(TradeDisplay != 0){
	//Buy = ExRem(Buy, Sell);
  	//Sell = ExRem(Sell, Buy); // THIS WILL REMOVE EXESS SIGNALS ON A CHART OR IN AN EXPLORATION
//}

//Filter =  Buy >2 <3 == BarCount+1 OR Sell >-3<-3 == BarCount+1;
Action = WriteIf(Buy, "BUY", WriteIf(Sell, "SELL", "   "));

//AddTextColumn(IndustryID(1), "Industry Sector  ", 30.0, colorBlue, colorYellow);
AddColumn(C, "Entry ", 2.2, colorWhite, colorBlue);
AddTextColumn(Action, "Action", 8.0, IIf(xh1, colorDarkGreen, colorDarkRed), colorYellow);
AddColumn(IIf(XH1, H1, L1), "BREAKOUT LEVEL", 3.2, colorYellow, IIf(XH1, colorDarkGreen, colorDarkRed));

// -----------------------------------------------------------------------------------  Arrow signals --- FOR TRADES  ----------------------------------------------------------
//PlotShapes(Buy *shapeUpArrow, colorBrightGreen, 0, L /* ENTRY_TRAILARRAY */,  - 30);
//PlotShapes(Sell *shapeDownArrow, colorLightYellow, 0, H,  - 30);
_SECTION_END();


_SECTION_BEGIN("Volume At Price");
PlotVAPOverlay(Param("Lines", 1000, 100, 1000, 10), Param("Width", 15, 1, 100, 1), ParamColor("Color", colorBlue), ParamToggle("Side", "Left|Right", 1) | 4 *ParamToggle("Z-order", "On top|Behind", 1));

_SECTION_END();
//Filter =  Buy OR Sell;

//AddColumn( IIf( Buy, 66, 1 ), "Buy", formatChar, 1, bkcolor = IIf( Buy, 43, 33 ) );

//AddColumn( IIf( Sell, 83, 1 ), "Sell", formatChar, 1, bkcolor = IIf( Sell, 25, 32 ) );


//AddColumn( C, "CMP", 1.2, colorDefault, colorLightBlue );

//AddColumn( BP, "SELL PRICE", 1.2, colorDefault, colorGreen );

//AddColumn( BPTGT, "TGT PRICE", 1.2, colorDefault, colorBrown );

//AddColumn( BPSTPLS, "STPLS BUY", 1.2, colorDefault, colorRed );

AddColumn( p, "PIVOT", 1.2, colorDefault, colorYellow );

//AddColumn( SPSTPLS, "STPLS SELL", 1.2, colorDefault, colorRed );

//AddColumn( SP, "SELL PRICE", 1.2, colorDefault, colorGreen );

//AddColumn( SPTGT, "TGT PRICE", 1.2, colorDefault, colorBrown );


//Settings for exploration

Filter=Buy OR Short;
AddColumn( IIf( Buy, 66 , 83 ), "Signal", formatChar, colorDefault, IIf( Buy , colorGreen, colorRed ) );

//AddColumn(Close,"Entry Price",1.4, colorDefault, IIf( Buy , colorGreen, colorRed ));
AddColumn(dtsl,"Stop Loss",1.4, colorDefault, IIf( Buy , colorGreen, colorRed ));
AddColumn(tar1,"Target 1",1.4, colorDefault, IIf( Buy , colorGreen, colorRed ));
AddColumn(tar2,"Target 2",1.4, colorDefault, IIf( Buy , colorGreen, colorRed ));
AddColumn(tar3,"Target 3",1.4, colorDefault, IIf( Buy , colorGreen, colorRed ));
AddColumn(Volume,"Volume",1.0, colorDefault, IIf ((Volume > 1.25 * EMA( Volume, 34 )),colorBlue,colorYellow));
AddColumn( H1, "PRE-HIGH" );

AddColumn( L1, "PRE-LOW" );

AddColumn( D1, "PRE-DIFF" );

AddColumn( F1, "0.433" );

AddColumn( F2, "0.766" );

AddColumn( F3, "1.35" );

AddColumn( H2, "D-HIGH" );

AddColumn( L2, "D-LOW" );

AddColumn( D2, "D-DIFF" );

AddColumn( F4, "SELECT FACT" );

//AlertIf( Buy , "SOUND C:\\Windows\\Media\\chimes.wav", "Audio alert", 2 );
//AlertIf( Sell , "SOUND C:\\Windows\\Media\\alert.wav", "Audio alert", 2 );

}
//Short = Sell;
//Cover = Buy;

//Short = ExRem(Short, Cover);
//Cover = ExRem(Cover, Short);


pxHeight = Status( "pxchartheight" ) ;
xx = Status( "pxchartwidth");
Left = 1100;
width = 310;
x = 5;
x2 = 280;

y = pxHeight;
dist = 2*ATR(10);
dist1 = 3*ATR(10);
 i=BarCount;
    bars = i;

if(messageboard)
{
for( i = 0; i < BarCount; i++ )
{
    if( Buy[i] )
    {
        // PlotText( "\nBuy:" + L[ i ] + "\nT= " + (L[i]*1.005) + "\nSL= " + (L[i]*0.9975), i, L[ i ]-dist[i], colorGreen, colorWhite );

        // Signal Display Panel //

       SellPrice=ValueWhen(Sell,C,1);
       BuyPrice=ValueWhen(Buy,L[ i ]);
       Long=Flip(Buy,Sell);
        Shrt=Flip(Sell,Buy );
        BuyStop2 = L[i]*0.9975;
        BuyTP1 = L[i]*1.070;
        BuyTP2 = L[i]*1.050;
        BuyTP3 = L[i]*1.035;
buyach1 = IIf((Buy OR Long AND NOT Relax AND NOT Cover AND NOT Short AND NOT Shrt), H > BuyTP3, 0);
buyach2 = IIf((Buy OR Long AND NOT Relax AND NOT Cover AND NOT Short AND NOT Shrt), H > BuyTP2, 0);
buyach3 = IIf((Buy OR Long AND NOT Relax AND NOT Cover AND NOT Short AND NOT Shrt), H > BuyTP1, 0);
        GfxSelectFont( "Tahoma", 13, 100 );
        GfxSetOverlayMode( mode = 0 );
        GfxSelectPen( colorBrightGreen, 3 );
        GfxSelectSolidBrush( colorBrightGreen);
        GfxRoundRect( x, y - 163, x2, y , 7, 7 ) ;
       GfxSetTextColor( colorGold );
       GfxTextOut( ( " Trading System "),73,y-165);
        GfxTextOut( (" "),27,y-160);
        GfxSetBkMode(1);
        GfxSelectFont( "Arial", 10, 700, False );
        GfxSetTextColor( colorBlue );
        GfxSetTextAlign(0);
        GfxSelectFont( "Tahoma", 13, 100 );

   GfxTextOut( WriteIf(L[ i ], "Buy Above: "+L[ i ],""), 13, y-140);
   GfxSetTextColor( colorGold );
   GfxTextOut( WriteIf(BuyStop2, "Long SL: "+(BuyStop2),""), 13, y-120);
   GfxSetTextColor( colorWhite );
   GfxTextOut( WriteIf(BuyTP1, "Buy TGT1: "+(BuyTP3),""), 13,y- 100);
   GfxTextOut( WriteIf(BuyTP2, "Buy TGT2: "+(BuyTP2),""), 13,y- 80);
   GfxTextOut( WriteIf(BuyTP3, "BuyTGT3: "+(BuyTP1),""), 13,y- 60);
   GfxSetTextColor( colorViolet );
   GfxTextOut( ("Current P/L : " + WriteVal(IIf(Buy ,(C-BuyPrice),(C-BuyPrice)),2.2)), 88, y-22);
  GfxTextOut( ("Buy  Signal came " + (BarCount-bars +1) * Interval()/3 + " mins ago"), 13, y-40) ;
GfxTextOut
( ("" + WriteIf (buyach1, " Done: "+BuyTP3,"")), 160, y-100);
GfxTextOut
( ("" + WriteIf (buyach2, " Done: "+BuyTP2,"")), 160, y-80);
GfxTextOut
( ("" + WriteIf (buyach3, " Done: "+BuyTP1,"")), 160, y-60);
        // END of Signal Display Panel //
    }
    if( Sell[i] )
    {
        // PlotText( "Sell:" + H[ i ] + "\nT= " + (H[i]*0.995) + "\nSL= " + (H[i]*1.0025), i, H[ i ]+dist1[i], colorRed, colorWhite );

        // Signal Display Panel //
        SellPrice=ValueWhen(Sell,C,1);
BuyPrice=ValueWhen(Buy,H[ i ]);
Long=Flip(Buy,Sell);
Shrt=Flip(Sell,Buy );
       SellStop2 = H[i]*1.0025;
        SellTP1 = H[i]*0.978;
        SellTP2 = H[i]*0.982;
        SellTP3 = H[i]*0.988;
sellach1 = IIf((Short OR Shrt AND NOT Relax AND NOT Sell AND NOT Buy AND NOT Long), L < SellTP3 , 0);
sellach2 = IIf((Short OR Shrt AND NOT Relax AND NOT Sell AND NOT Buy AND NOT Long), L < SellTP2, 0);
sellach3 = IIf((Short OR Shrt AND NOT Relax AND NOT Sell AND NOT Buy AND NOT Long), L < SellTP1, 0);

        GfxSelectFont( "Tahoma", 13, 100 );
        GfxSetOverlayMode( mode = 0 );
        GfxSelectPen( colorRed, 3 );
        GfxSelectSolidBrush( colorRed );
         GfxRoundRect( x, y - 163, x2, y , 7, 7 ) ;

        GfxTextOut( (" "),27,y-160);
        GfxSetBkMode(1);
        GfxSelectFont( "Arial", 10, 700, False );
        GfxSetTextColor( colorWhite );
        GfxSetTextAlign(0);
        GfxSelectFont( "Tahoma", 13, 100 );
        GfxSetTextColor( colorGold );
        GfxTextOut( ( " Trading System "),73,y-165);
        GfxSetTextColor( colorWhite );
       GfxTextOut( WriteIf(H[ i ], "Sell Below: "+H[ i ],""), 13, y-140);
       GfxSetTextColor( colorGold );
       GfxTextOut( WriteIf(SellStop2, "Short SL: "+(SellStop2),""), 13, y-120);
       GfxSetTextColor( colorBlue );
       GfxTextOut( WriteIf(SellTP1, "Short TGT1: "+(SellTP3),""), 13, y-100);
       GfxTextOut( WriteIf(SellTP2, "Short TGT2: "+(SellTP2),""), 13, y-80);
       GfxTextOut( WriteIf(SellTP3, "Short TGT3: "+(SellTP1),""), 13, y-60);
       GfxSetTextColor( colorGold );
       GfxTextOut( ("Current P/L : " + WriteVal(IIf(Sell ,(SellPrice-C),(SellPrice-C)),2.2)), 88, y-22);
        GfxTextOut( ("sell Signal came " + (BarCount-bars +1) * Interval()/1 + " mins ago"), 13, y-40) ;
       GfxTextOut
( ("" + WriteIf (sellach1, "  Done: "+SellTP3,"")), 160, y-100);
GfxTextOut
( ("" + WriteIf (sellach2, "  Done: "+SellTP2,"")), 160, y-80);
GfxTextOut
( ("" + WriteIf (sellach3, "  Done: "+SellTP1,"")), 160, y-60);
// END of Signal Display Panel //
    }}}


for( i = 0; i < BarCount; i++ )
{
 if( Buy[i] )
 {

OUTcolor = ParamColor("Outer Panel Color",colorTeal);
INUPcolor = ParamColor("Inner Panel Upper",colorDarkGreen);
INDNcolor = ParamColor("Inner Panel Lower",colorDarkOliveGreen);
TitleColor = ParamColor("Title Color ",colorBlack);
SetChartBkColor(OUTcolor); // color of outer border
SetChartBkGradientFill(INUPcolor,INDNcolor,TitleColor); // color of inner panel
}
if( Sell[i] )
{
OUTcolor = ParamColor("Outer Panel Color",colorTeal);
INUPcolor = ParamColor("Inner Panel Upper2",colorDarkRed);
INDNcolor = ParamColor("Inner Panel Lower2",colorPlum);
TitleColor = ParamColor("Title Color ",colorBlack);
SetChartBkColor(OUTcolor); // color of outer border
SetChartBkGradientFill(INUPcolor,INDNcolor,TitleColor); // color of inner panel
}
}


_SECTION_BEGIN("Pivot calc");
pd = Param("Periods",13,5,144,1);
pds = 2*pd-1;//     (Adjustment for Wilders MA)
aa = Close-Ref(Close,-1);
uu = EMA(Max(0,aa),pds);
dd=  EMA((Max(0,0-aa)),pds);

rf = IIf(C>2,1000,10000);

c1 = Param("Upper Level",70,50,90,1);
qq1 =100/(100-c1)-1;
ff1 = qq1*dd-uu;
ff2 = ff1/qq1;
f1 = Max(ff1,ff2);
UL = Close + f1*(pds-1)/2;
UL = IIf(UL>C,floor(UL*rf),ceil(UL*rf))/rf;

c2 = Param("Equilibrium",50,50,50,0);
qq2 =100/(100-c2)-1;// [=1]
ff = dd-uu;
MM = Close + ff*(pds-1)/2;
MM = IIf(MM>C,floor(MM*rf),ceil(MM*rf))/rf;

c3 = Param("Lower Level",30,10,50,1);
qq3 =100/(100-c3)-1;
ff1 = qq3*dd-uu;
ff2 = ff1/qq3;
f3 = Min(ff1,ff2);
LL = Close + f3*(pds-1)/2;
LL = IIf(LL>C,floor(LL*rf),ceil(LL*rf))/rf;

band = Param("band width",4,0,15,0.25);
mmu = MM+band;
mmd = MM-band;


X=Cross( C,LL);
Y=Cross(UL,C);

Buy1= X ;
Sell1= Y ;

TimeFrameSet( in15Minute*2 );
DH=Ref(H,-1);
DL=Ref(L,-1);
DC=Ref(C,-1);


pd = ( DH+ DL + DC )/3;
sd1 = (2*pd)-DH;
sd2 = pd -(DH - DL);
sd3 = Sd1 - (DH-DL);
rd1 = (2*pd)-DL;
rd2 = pd +(DH -DL);
rd3 = rd1 +(DH-DL);

TimeFrameRestore();

_SECTION_END();


Title =
EncodeColor(colorWhite) +  Name() + " - " + EncodeColor(colorRed)+ Interval(2)
+ EncodeColor(colorWhite) +  "  - " + Date() +" - "
+"\n"

+EncodeColor(colorYellow) +"Op-"+O+"  "+"Hi-"+H+"  "+"Lo-"+L+"  "+ "Cl-"+C+"  "+ "Vol= "+ WriteVal(V)
//+ WriteIf ((e3>e45) ,EncodeColor(colorLime)+ "      Direction : LONG",EncodeColor(colorRed)+"      Direction : SHORT")
+"\n"
+ WriteIf (Sell , " EXIT LONG / Reverse Signal at "+C+"\n","")
+ WriteIf (Buy , " EXIT SHORT / Reverse Signal at "+C+"\n","")

+WriteIf(Sell , "Total Profit / Loss for the Last Trade Rs."+(C-BuyPrice)+"","")+
WriteIf(Buy , "Total Profit / Loss for the Last trade Rs."+(SellPrice-C)+"","")+
WriteIf(Long AND NOT Buy,EncodeColor(colorLime)+  "Trade : Long - Entry price Rs."+(BuyPrice)+" Tgt : "+UL,"")+
WriteIf(shrt AND NOT Sell,EncodeColor(colorRed)+ "Trade : Short - Entry price Rs."+(SellPrice)+" Tgt : "+LL,"")+"\n"+
WriteIf(Long AND NOT Buy, "Current Profit / Loss Rs."+(C-BuyPrice)+"","")+
WriteIf(shrt AND NOT Sell, "Current Profit / Loss Rs."+(SellPrice-C)+"","")
+ EncodeColor(colorBrightGreen)+   "\n R3 : "+ EncodeColor(colorWhite)+RD3
+ EncodeColor(colorBrightGreen)+   "\n R2 : "+ EncodeColor(colorWhite)+RD2
+ EncodeColor(colorBrightGreen)+   "\n R1 : "+ EncodeColor(colorWhite)+RD1 + EncodeColor(colorBrightGreen)+  "     UP TGT   : "+ EncodeColor(colorWhite)+UL
+ EncodeColor(colorBlue)+   "\n Pivot : "+ EncodeColor(colorWhite)+pd+ EncodeColor(colorBlue)+   "     MIDPOINT : "+ EncodeColor(colorWhite)+MM
+ EncodeColor(colorRed)+   "\n S1 : "+ EncodeColor(colorWhite)+SD1   + EncodeColor(colorRed)+    "     BOT TGT  : "+ EncodeColor(colorWhite)+LL
+ EncodeColor(colorRed)+   "\n S2 : "+ EncodeColor(colorWhite)+SD2
+ EncodeColor(colorRed)+   "\n S3 : "+ EncodeColor(colorWhite)+SD3;

if(bslable==0)
{
dist = 1.0*ATR(10);
dist1= 2.0*ATR(10);
for( i = 0; i < BarCount; i++ )
{
if( Buy[i] )
{
//PlotText( WriteVal(H[ i ],1.3) + "\n" + WriteVal(C[i],1.2), i, L[ i ]-dist[i], colorLime, colorBlack );
PlotText( WriteVal(L[ i ],1.2), i, L[ i ]-dist[i], colorBlue, colorWhite );
}
if( Sell[i] )
{
//PlotText( "" + WriteVal(L[ i ],1.3)+ "\n" + WriteVal(C[i],1.2), i, H[ i ]+dist1[i], colorRed, colorBlack );
PlotText( WriteVal(H[ i ],1.2), i, H[ i ]+dist1[i], colorRed, colorWhite );
}}}


if (EndValue(Buy)==1) Say("strong Buy go long dear",-1);
if (EndValue(Sell)==1) Say("strong Sell go short dear",-1);
//if (EndValue(Cover)==1) Say(" go long dear");
//if (EndValue(Short)==1) Say(" go short dear");
17 comments
Leave Comment
Please login here to leave a comment.
Dear jaipall,
Error 29, ln: 266, col: 16. Variable ‘sell’ used without having been initialized.
Tks
jaipallji,
getting error check and again post correct formula …kindly request to post correct formula check ten time then post…..thanks
jaipall sir,
Error 29, ln: 266, col: 16. Variable ‘sell’ used without having been initialized.
jaipallji,
which dll required for the below function? getting error ?
E_TSKPUPSELL=TSF;
plz remove its error and post it. afl looks so good and effective
Hi!
It is giving error please correct it as indicator looks good and may be much helpful to many trader
E_TSKPUPSELL
remove _
and use only ETSKPUPSELL=
in all formulas remove _
use simple arrey..working fine…enjoy
otw download link here
http://www.mediafire.com/?b3m575zog2v107r
Thanks Jaipall7786
info
“signals buy ,sell from x min” in square are wrong
Dear Admin – could you help in fixing the errors?
write errors details
Tested formula. No errors found.
Please tell me how to use this fomula
Thank very much
Thank you rkkvanj, this one works :-)
By chance, do youy know if there exists any way to convert the dlls (Jurik and kpami) from 32-bit to 64-bit. For thos great codes I ahve to use old 32-bit version of amibroker
Jaipal Ji
The Alert Out put not giving proper alerts, instead the candle colour change is very useful to decide to take trade. How to change the Alert output based on the colour changing of candles