ConnorsRSI Upgraded for Amibroker (AFL)
ferpa over 13 years ago Amibroker (AFL)
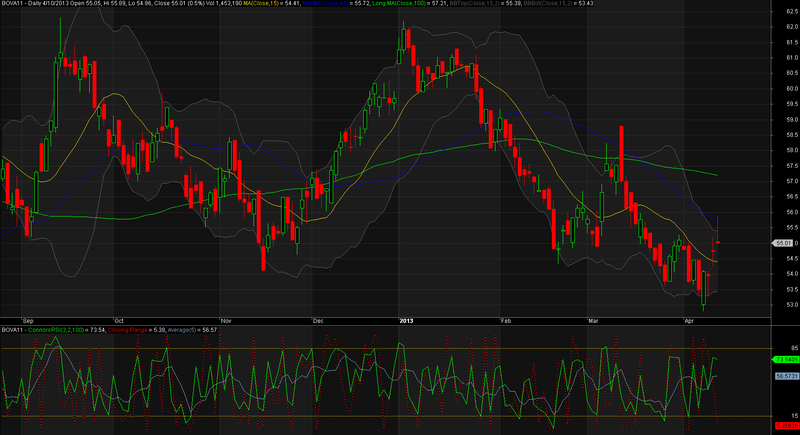
The ConnorsRSI indicator was created by Larry Connors of Connors Research. It combines three equally weighted constituents, representing price momentum, duration of up/down trend, and relative magnitude of price change:
Price momentum is measured by fast 3-period RSI
Duration of up/down trend is the sensitive 2-period RSI of closing price’s streaks. Streaks are recorded in an oscillating manner: for example, 2 consecutive closes up give a reading of 2, 3 consecutive declining closes give a -3, and an unchanged price is 0.
Relative magnitude of price change compares the most-recent bar’s price change to previous price changes using the PercentRank function, or a percentile. We will use 1-day change of close price.
The three components of ConnorsRSI are averaged into the new indicator as follows:
ConnorsRSI(3,2,100) = [ RSI + RSI + PercentRank(100) ] / 3
- New: ConnorsRSI Average;
- New: Plot Closing Range;
- Added: Backtest.
Screenshots
Indicator / Formula
paramLenRSI = Param("RSI Closes Length", 3, 2, 100, 1);
paramLenUD = Param("RSI UpClose Length", 2, 2, 100, 1);
paramLenRank = Param("PercentRank Length", 100, 10, 252, 1);
paramAverage = Param("Average", 5, 1, 100, 1);

function ConnorsRSI(lenRSI, lenUD, lenROC)
{
      upDays = BarsSince(C <= Ref(C,-1));
      downDays = BarsSince(C >= Ref(C,-1));
      updownDays = IIf(upDays > 0, upDays, IIf(downDays > 0, -downDays, 0));
      crsi = ( PercentRank(ROC(C,1), lenROC) + RSIa(updownDays,lenUD) +
RSI(lenRSI))/3;
      return crsi;
}

function ClosingRange() {
	return ((C - L) / (H - L)) * 100;
}

Plot( ConnorsRSI(paramLenRSI,paramLenUD,paramLenRank)
      , "ConnorsRSI("+paramLenRSI+","+paramLenUD+","+paramLenRank+")"
      , colorBrightGreen, styleLine, 0, 100);

Plot(ClosingRange(), "Closing Range", colorRed, styleDashed);

Plot( MA(ConnorsRSI(paramLenRSI,paramLenUD,paramLenRank), paramAverage)
      , "Average("+paramAverage+")"
      , colorLightBlue, styleLine, 0, 100);

PlotGrid(85, colorGold);
PlotGrid(15, colorGold);

SetTradeDelays(0,0,0,0);
BuyPrice = C;
SellPrice = C;
NumberPositions = 10;
SetOption("MaxOpenPositions", NumberPositions);
PositionSize = -100 / NumberPositions;
Buy = ConnorsRSI(paramLenRSI,paramLenUD,paramLenRank) < 15 AND ClosingRange() < 25;
Sell = ConnorsRSI(paramLenRSI,paramLenUD,paramLenRank) > 70;
Short = ConnorsRSI(paramLenRSI,paramLenUD,paramLenRank) > 85 AND ClosingRange() > 75;
Cover = ConnorsRSI(paramLenRSI,paramLenUD,paramLenRank) < 30;
Lookback = 5;
PositionScore = -ROC(C,Lookback);
2 comments
Leave Comment
Please login here to leave a comment.
Hi,
Ideally if this should have accompanied the buy and sell signal or arrow it would have been ideal. Thanks,
thanks