RSI BUY SELL for Amibroker (AFL)
selva_klt about 13 years ago Amibroker (AFL)
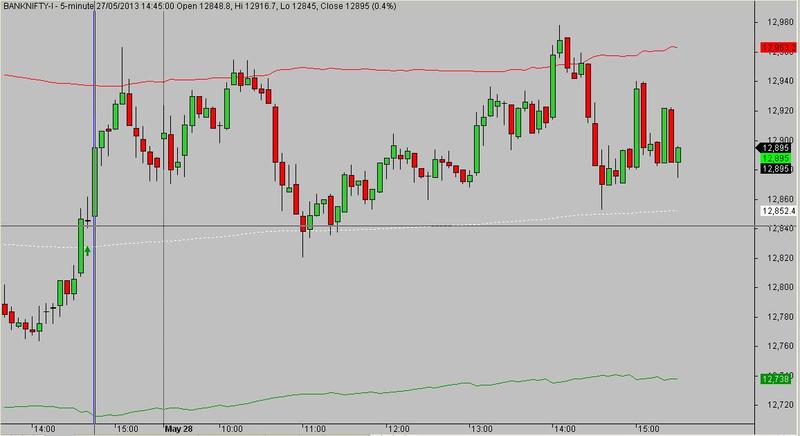
This is very interesting AFL for Amy
when it candil close above white line start buy and u can sell candil close below white line or maintain SL @ White line u can trade any way
I dedicate this to Prakash Srikath
Screenshots
Indicator / Formula
Copy & Paste Friendly
_SECTION_BEGIN("Price");
SetChartOptions(0,chartShowArrows|chartShowDates);
_N(Title = StrFormat("{{NAME}} - {{INTERVAL}} {{DATE}} Open %g, Hi %g, Lo %g, Close %g (%.1f%%) {{VALUES}}", O, H, L, C, SelectedValue( ROC( C, 1 ) ) ));
Plot( C, "Close", ParamColor("Color", colorBlack ), styleNoTitle | ParamStyle("Style") | GetPriceStyle() );
_SECTION_END();

// RSI Levels - appplied to Price Chart shows how far
// tomorrow's closing price has to move in order for
// the RSI to cross the 70, 50 & 30 levels.

pd = Param("Periods",200,5,200,1);
pds = 2*pd-1;//     (Adjustment for Wilders MA)

aa = Close-Ref(Close,-1);
uu = EMA(Max(0,aa),pds);
dd=  EMA((Max(0,0-aa)),pds);

rf = IIf(C>2,1000,10000);

c1 = Param("Upper Level",52,50,90,1);
qq1 =100/(100-c1)-1;
ff1 = qq1*dd-uu;
ff2 = ff1/qq1;
f1 = Max(ff1,ff2);
UL = Close + f1*(pds-1)/2;
UL = IIf(UL>C,floor(UL*rf),ceil(UL*rf))/rf;

c2 = Param("Equilibrium",50,50,50,0);
qq2 =100/(100-c2)-1;// [=1]
ff = dd-uu;
MM = Close + ff*(pds-1)/2;
MM = IIf(MM>C,floor(MM*rf),ceil(MM*rf))/rf;

c3 = Param("Lower Level",48,10,50,1);
qq3 =100/(100-c3)-1;
ff1 = qq3*dd-uu;
ff2 = ff1/qq3;
f3 = Min(ff1,ff2);
LL = Close + f3*(pds-1)/2;
LL = IIf(LL>C,floor(LL*rf),ceil(LL*rf))/rf;

Plot(UL,"",colorRed,1);
Plot(MM,"",colorWhite,32);
Plot(LL,"",colorGreen,1);

Cbr = IIf(UL<C,27,IIf(LL>C,32,IIf(MM>C,11,8)));
PlotOHLC(O,H,L,C,"",cbr,styleCandle);
pema=Param("Per",3,1,10,1);
Buy=Cross(EMA(C,pema),mm);
Sell=Cross(mm,EMA(C,pema));
shape=Buy*shapeUpArrow+Sell*shapeDownArrow;
PlotShapes( shape, IIf( Buy, colorGreen, colorRed ), 0, IIf( Buy, L-10, IIf(Sell,H+10,Null)));


Title = Name() + "  -  RSI(" + WriteVal(pd,0.0) + ")  -  Close=" +  WriteVal(Close,0.3) + "    UL=" +  WriteVal(UL,0.4) + "    MM=" +  WriteVal(MM,0.4) + "    LL=" +  WriteVal(LL,0.4);_SECTION_BEGIN("Price");
SetChartOptions(0,chartShowArrows|chartShowDates);
_N(Title = StrFormat("{{NAME}} - {{INTERVAL}} {{DATE}} Open %g, Hi %g, Lo %g, Close %g (%.1f%%) {{VALUES}}", O, H, L, C, SelectedValue( ROC( C, 1 ) ) ));
Plot( C, "Close", ParamColor("Color", colorBlack ), styleNoTitle | ParamStyle("Style") | GetPriceStyle() );
_SECTION_END();
3 comments
Leave Comment
Please login here to leave a comment.
sir it is good one . let me know what is ur mail or chat id ? can u pls tell me how to get this formula normel . thanks
this is my yahoo chat id
srisairamstocks@yahoo.com
great job. and how to sound alert set when bar close below line?