_MultiShow Indicator *Updated* for Amibroker (AFL)
Dryden about 13 years ago Amibroker (AFL)
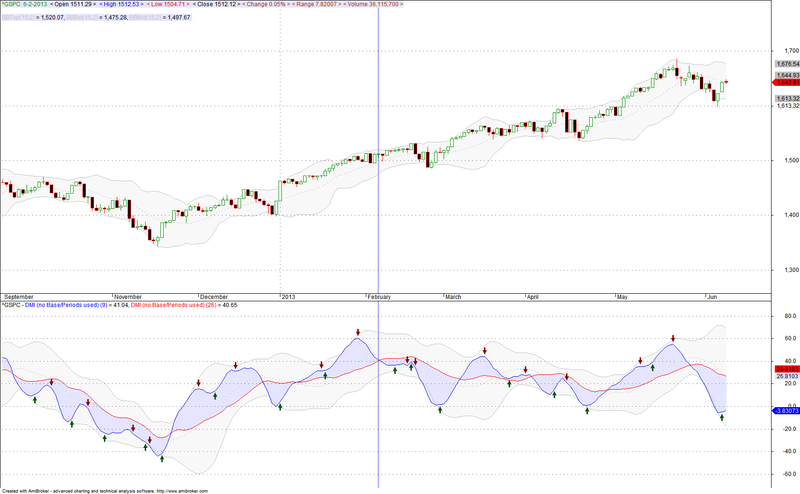
An update to the previous code
Screenshots
Indicator / Formula
Copy & Paste Friendly
_SECTION_BEGIN("_MultiShow Indicator");

GraphXSpace = 25;

indyOpt = ParamList("Indicator", "MA|EMA|TEMA|DEMA|WMA|Wilders|DMI (no Base/Periods used)");
periods = Optimize("period ",Param("DPO periods ",7,1,50,1),1,50,2);
Fast = Optimize("Fast",Param("Fast-Line ( blue )",9,1,28,1),1,28,1);
Slow = Optimize("Slow",Param("Slow-Line ( red )",26,1,28,1),1,28,1);
Base = ParamList("Base", "DPO|Close|RSIa (DPO)");

//DetrendedPriceOsc
////////////////////////////////////////////////////////////////////////////////
function DetrendedPriceOsc( Periods )
{
return C- AMA(Ref( EMA( C, Periods ), -( 1 + Periods/2 ) ),0.5);
}
////////////////////////////////////////////////////////////////////////////////

//Dynamic Momentum Index Tushar Chande Translated to AFL by Jayson Casavant
////////////////////////////////////////////////////////////////////////////////
//Cmo5 formula
CMO5_1=Sum( IIf( C > Ref( C, -1 ) , ( C - Ref( C ,-1 ) ) ,0 ) ,5 ) ;
CMO5_2=Sum( IIf( C < Ref( C ,-1 ) , ( Ref( C ,-1 ) - C )  ,0 ) ,5 );
CMO5=DEMA(100 * Nz(( CMO5_1 -CMO5_2)  /( CMO5_1+CMO5_2)),3);

//Cmo10 formula
CMO10_1=Sum( IIf( C > Ref( C, -1 ) , ( C - Ref( C ,-1 ) ) ,0 ) ,10 ) ;
CMO10_2=Sum( IIf( C < Ref( C ,-1 ) , ( Ref( C ,-1 ) - C )  ,0 ) ,10 );
CMO10=DEMA(100 * Nz(( CMO10_1 -CMO10_2)  /( CMO10_1+CMO10_2)),3);

//Cmo20 formula
CMO20_1=Sum( IIf( C > Ref( C, -1 ) , ( C - Ref( C ,-1 ) ) ,0 ) ,20 ) ;
CMO20_2=Sum( IIf( C < Ref( C ,-1 ) , ( Ref( C ,-1 ) - C )  ,0 ) ,20 );
CMO20=DEMA(100 * Nz(( CMO20_1 -CMO20_2)  /( CMO20_1+CMO20_2)),3);

// dmi formula
dmi=((StDev(C,5)* CMO5)+(StDev(C,10)* CMO10)+(StDev(C,20)*
CMO20))/(StDev(C,5)+StDev(C,10)+StDev(C,20));
////////////////////////////////////////////////////////////////////////////////

switch (Base)
{
	case "DPO":
	SetChartOptions(1,0);
	ArrayBase = DetrendedPriceOsc( Periods );
	break;

	case "Close":
	SetChartOptions(1,0,chartGridMargins);
	ArrayBase = Close;
	break;

	case "RSIa (DPO)":
	SetChartOptions(1,0,chartGrid20|chartGrid30 |chartGrid50 |chartGrid70|chartGrid80);
	ArrayBase = RSIa(DetrendedPriceOsc( Periods ),Periods);
	break;
}

ArrayFast =0;
ArraySlow =0;

switch (indyOpt)
{
	case "MA":
	ArrayFast = MA ( ArrayBase, Fast );
	ArraySlow = MA ( ArrayBase, Slow );
	break;

	case "EMA":
	ArrayFast = EMA ( ArrayBase, Fast );
	ArraySlow = EMA ( ArrayBase, Slow );
	break;

	case "TEMA":
	ArrayFast = TEMA ( ArrayBase, Fast );
	ArraySlow = TEMA ( ArrayBase, Slow );
	break;

	case "DEMA":
	ArrayFast = DEMA ( ArrayBase, Fast );
	ArraySlow = DEMA ( ArrayBase, Slow );
	break;

	case "WMA":
	ArrayFast = WMA( ArrayBase, Fast );
	ArraySlow = WMA( ArrayBase, Slow );
	break;

	case "Wilders":
	ArrayFast = Wilders ( ArrayBase, Fast );
	ArraySlow = Wilders ( ArrayBase, Slow );
	break;

	case "DMI (no Base/Periods used)":
	SetChartOptions(1,0);
	ArrayFast = ArrayMA   =EMA(dmi,Fast);
	ArraySlow = ArrayEMA =MA(dmi,Slow);
	break;
}

Plot ( ArrayFast , indyOpt+ " ("+fast+")", colorBlue);
Plot ( ArraySlow , indyOpt+ " ("+slow+")", colorRed);
PlotOHLC (ArrayFast ,ArrayFast ,ArraySlow ,ArraySlow ,"",ColorBlend( colorWhite, colorBlue, 0.1 ), styleCloud | styleNoRescale | styleNoTitle , Null, Null, Null, -1 );;

_SECTION_END();

//////////////////////////////////////////////////////////////////////////////

_SECTION_BEGIN("Buy/Sell Criteria");

//Entry Criteria Long
Long1 = (ArraySlow -ArrayFast ) < Ref((ArraySlow -ArrayFast ),-1) ;
//Entry Criteria Short //
Short1 = (ArraySlow -ArrayFast ) > Ref((ArraySlow -ArrayFast ),-1) ;

Buy= Long1 ;
Sell=0;
Short= Short1 ;
Cover=0;

Buy=ExRem(Buy,Short);
Short=ExRem(Short,Buy);

PlotShapes( Buy * shapeUpArrow , colorDarkGreen, 0);
PlotShapes( Short * shapeDownArrow , colorDarkRed, 0);

_SECTION_END();

//////////////////////////////////////////////////////////////////////////////

_SECTION_BEGIN("Ribbon");
ShowRibbon = ParamToggle("Ribbon","No|Yes",1);
uptrend=Buy;
downtrend=Short;
if (ShowRibbon ) Plot( 2, "Ribbon",IIf( Long1 , colorSeaGreen, IIf( Short1 , colorOrange, colorLavender )), styleOwnScale|styleArea|styleNoLabel|styleNoTitle , -0.5, 100 );

_SECTION_END();

//////////////////////////////////////////////////////////////////////////////

_SECTION_BEGIN("Bollinger Bands (Area)");
P = ParamField("Price field",-1);
Periods = Param("Periods", 15, 2, 100, 1 );
Width = Param("Width", 2, 0, 10, 0.05 );
Color = ParamColor("Color", colorLightGrey );
Style = ParamStyle("Style") | styleNoRescale | styleNoTitle | styleNoLabel   ;;
Plot( bbt = BBandTop( P, Periods, Width ), "BBTop" + _PARAM_VALUES(), Color, Style );
Plot( bbb = BBandBot( P, Periods, Width ), "BBBot" + _PARAM_VALUES(), Color, Style );
PlotOHLC( bbt, bbt, bbb, bbb, "", ColorBlend( Color, colorWhite, 0.9 ), styleCloud | styleNoRescale | styleNoLabel | styleNoTitle  , Null, Null, Null, -1 );
bbm = ((bbt +bbb )/2);
Plot( bbm , "BBMid" + _PARAM_VALUES(), Color, styleDashed | styleNoRescale  | styleNoLabel | styleNoTitle );
_SECTION_END();

//////////////////////////////////////////////////////////////////////////////
0 comments
Leave Comment
Please login here to leave a comment.