FUNPROFIT for Amibroker (AFL)
jaipal7786 about 13 years ago Amibroker (AFL)
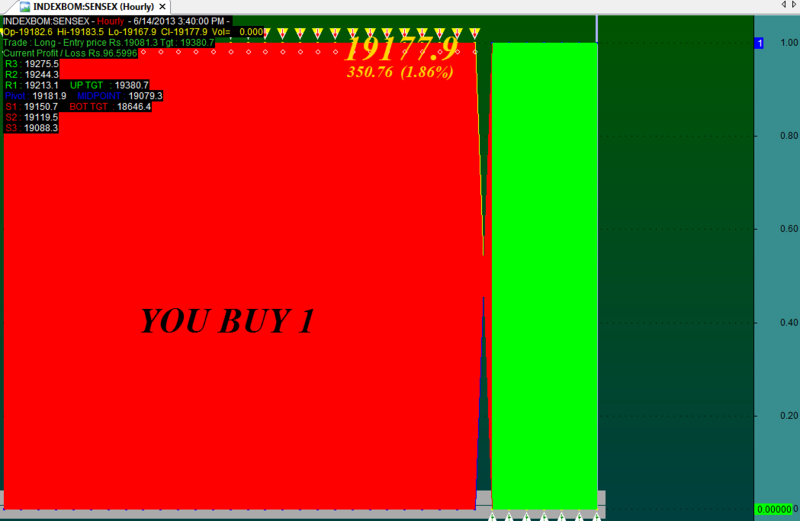
IT IS THE DIFERENT TYPE OF AFL USE IT AND SEND FEEDBACK OR GIVE STAR….
Screenshots
Indicator / Formula
Copy & Paste Friendly
bbm = ParamToggle("bbma","Show|Hide",1);
bbms = ParamToggle("bbms","Show|Hide",0);
skip = ParamToggle("skip","Show|Hide",0);
font = ParamToggle("font","Show|Hide",1);
messageboard = ParamToggle("Message Board","Show|Hide",0);
prexplore= ParamToggle("perce/buysell","pers|buysell",1);
bslable= ParamToggle("bslable","Show|Hide",1);
trigercloud=ParamToggle("trigercloud","Show|Hide",1);
Dispa=ParamToggle("KP Standard  Bands","Show|Hide",1);
Disp2=ParamToggle("KPAutoStop-KPA900 Trend","Show|Hide",1);
Disp3=ParamToggle("KPStopLine-KPTriggerLine","Show|Hide",1);
pxHeight = Status( "pxchartheight" ) ;
xx = Status( "pxchartwidth");
Left = 1100;
width = 310;
x = 5;
x2 = 280;
 no=10;
C13=20;
C14=2.1;
C15=12;
y = pxHeight;
dist = 2*ATR(10);
dist1 = 3*ATR(10);
 i=BarCount;
    bars = i;
fse=Param("Font Sizee",35,11,100,1);
aa1=EMA(C,30);
bb2=EMA(C,30);
Buy=Cover=aa=EMA(Avg,3) > aa1;
Sell =Short=bb= EMA(Avg,3) < bb2;

cola = IIf( fse=Param("Font Sizee",70,11,100,1)+
GfxSelectFont("Times New Roman", fse, 700, True )+
GfxSetBkMode( colorGold )+
GfxTextOut( "", Status("pxwidth")/C14, Status("pxheight")/C15*2.5 )+
aa*GfxTextOut( WriteIf(Buy, "YOU BUY "+Buy,""), 730,y- 280)>=fse=Param("Font Sizee",70,11,100,1)+
GfxSelectFont("Times New Roman", fse, 700, True )+
GfxSetBkMode( colorWhite )+
GfxTextOut( "", Status("pxwidth")/C14, Status("pxheight")/C15*2.5 )+
bb*GfxTextOut( WriteIf(Sell, "YOU SELL "+Sell,""), 730,y- 280),colorBrightGreen,colorRed);
PlotOHLC(aa,aa,bb,bb,"Cloud",Cola,styleCloud);
Plot (aa, "", ParamColor ("color1", colorBlue), styleLine | styleThick +8);
Plot (bb, "", ParamColor ("color2", colorYellow), styleLine | styleThick +8);
//Plot (C, "", ParamColor ("color3", colorDefault), styleCandle);

if(font==0)
{
_SECTION_BEGIN("Name");
GfxSetOverlayMode(0);
GfxSelectFont("Tahoma", Status("pxheight")/8 );
GfxSetTextAlign( 6 );// center alignment
GfxSetTextColor( ColorHSB( 42, 42, 42 ) );
GfxSetBkMode(0); // transparent
GfxTextOut( Name(), Status("pxwidth")/2, Status("pxheight")/12 );
GfxSelectFont("Tahoma", Status("pxheight")/18 );
GfxTextOut("" , Status("pxwidth")/2, Status("pxheight")/4 );
GfxSelectFont("Tahoma", Status("pxheight")/18 );
GfxSelectFont("Tahoma", Status("pxheight")/36 );
GfxTextOut( "", Status("pxwidth")/2, Status("pxheight")/3 );
_SECTION_END();

//Magfied Market Price
GfxSetTextAlign( 6 );// center alignment
FS=Param("Font Size",72,11,100,1);
GfxSelectFont("Times New Roman", FS, 700, True );
GfxSetBkMode(0); // transparent
GfxSetTextColor( ColorHSB( 42, 42, 42 ) );
Hor=Param("Horizonta Position",615,1,1200,1);
Ver=Param("Vertica Position",152,1,830,1);
GfxTextOut(""+C, Hor , Ver );
YC=TimeFrameGetPrice("C",inDaily,-1);
DD=Prec(C-YC,2);
GfxSetTextAlign( 6 );// center alignment
xx=Prec((DD/YC)*100,2);
FS2=Param("Font Size2",35,11,100,1);
GfxSelectFont("Times New Roman", FS2,11, 700, True );
GfxSetBkMode( colorBlack );
Hor1=Param("Horizontal Position",615,1,1200,1);
Ver1=Param("Vertical Position",188,1,830,1);
GfxSetTextColor( ColorHSB( 42, 42, 42 ) );
GfxTextOut(""+DD+"  ("+xx+"%)", Hor1 , Ver1+45 );
}
else
{{
//Magfied Market Price
GfxSetTextAlign( 6 );// center alignment
fse=Param("Font Sizee",35,11,100,1);
GfxSelectFont("Times New Roman", fse, 700, True );
GfxSetBkMode( colorGold );
GfxSetTextColor( ParamColor("Color",colorGold) );
Hora=Param("Horizontal Positiona",525,1,1200,1);
Vera=Param("Vertical Positiona",17,1,830,1);
GfxTextOut(""+C, Hora , Vera );
YCa=TimeFrameGetPrice("C",inDaily,-1);
DDa=Prec(C-YCa,2);
GfxSetTextAlign( 6 );// center alignment
xxa=Prec((DDa/YCa)*100,2);
FSb=Param("Font Sizeb",16,11,100,1);
GfxSelectFont("Times New Roman",fsb, 700, True );
GfxSetBkMode( colorBlack );
GfxSetTextColor(ParamColor("Color",colorYellow) );
GfxTextOut(""+DDa+"  ("+xxa+"%)", Hora , Vera+45 );
 _SECTION_END();
}}


PlotShapes( Buy * shapeUpArrow + Sell * shapeDownArrow, IIf( Buy, colorWhite, colorYellow ) );
PlotShapes( Buy * shapeUpTriangle + Sell * shapeDownTriangle, IIf( Buy, colorWhite, colorYellow ) );
PlotShapes( Buy * shapeHollowSmallCircle + Sell * shapeHollowSmallCircle, IIf( Buy, colorWhite, colorYellow ));
PlotShapes(IIf(Buy,shapeUpArrow,shapeNone),colorGreen);
PlotShapes(IIf(Buy,shapeHollowUpArrow,shapeNone),colorWhite);
PlotShapes(IIf(Buy,shapeHollowSmallCircle,shapeNone),colorWhite);

PlotShapes(IIf(Sell,shapeDownArrow,shapeNone),colorRed);
PlotShapes(IIf(Sell,shapeHollowDownArrow,shapeNone),colorWhite);
PlotShapes(IIf(Sell,shapeHollowSmallCircle,shapeNone),colorWhite);


Buy=ExRem(Buy,Sell);
Sell=ExRem(Sell,Buy);
AlertIf( Buy, "", "BUY @ " + C, 1 );
AlertIf( Sell, "", "SELL @ " + C, 2 );
no=Param( "Swing", 8, 1, 55 );
tsl_col=ParamColor( "Color", colorLightGrey );
res=HHV(H,no);
sup=LLV(L,no);
avd=IIf(C>Ref(res,-1),1,IIf(C<Ref(sup,-1),-1,0));
avn=ValueWhen(avd!=0,avd,1);
tsl=IIf(avn==1,sup,res);

no =  Optimize("TSL",Param("A (Change To Optimise)",10, 1, 55 ,1),1, 55 ,1);

tsl_col=ParamColor( "Color", colorLightGrey );
res=HHV(H,no);
sup=LLV(L,no);
avd=IIf(C>Ref(res,-1),1,IIf(C<Ref(sup,-1),-1,0));
avn=ValueWhen(avd!=0,avd,1);
dtsl=IIf(avn==1,sup,res);
SellPrice=ValueWhen(Short,C,1);
BuyPrice=ValueWhen(Buy,C,1);
Long=Flip(Buy,Sell);
Shrt=Flip(Short,Cover);
Relax = NOT Long AND NOT Buy AND NOT shrt AND NOT Sell AND NOT Sell AND NOT Cover;
SellSL=ValueWhen(Short,DTSL,1);
BuySL=ValueWhen(Buy,DTSL,1);
BuyDifference= BuyPrice - BuySL;
SellDifference = SellSL - SellPrice;

tar1 = IIf(Buy OR Long AND NOT Relax AND NOT Sell AND NOT Cover, (BuyPrice + BuyDifference), (SellPrice - SellDifference));
tar2 = IIf(Buy OR Long AND NOT Relax AND NOT Sell AND NOT Cover, (BuyPrice + (2*BuyDifference)), (SellPrice - (2*SellDifference)));
tar3 = IIf(Buy OR Long AND NOT Relax AND NOT Sell AND NOT Cover, (BuyPrice + (4*BuyDifference)), (SellPrice - (4*SellDifference)));


CloseAtEnd = ParamToggle("Close Positions EOD", "No|Yes");
stopreverse =ParamToggle("Switch To Stop And Reverse","No|Yes",0);
Trend = ATR(21) < StDev (C,21);
Range = ATR(21) > StDev (C,21);


tsl_col=ParamColor( "Color", colorLightGrey );
res=HHV(H,no);
sup=LLV(L,no);
avd=IIf(C>Ref(res,-1),1,IIf(C<Ref(sup,-1),-1,0));
avn=ValueWhen(avd!=0,avd,1);
dtsl=IIf(avd==1,sup,res);

SellPrice=ValueWhen(Short,C,1);
BuyPrice=ValueWhen(Buy,C,1);
Long=Flip(Buy,Sell);
Shrt=Flip(Short,Cover);
Relax = NOT Long AND NOT Buy AND NOT shrt AND NOT Sell AND NOT Sell AND NOT Cover;
SellSL=ValueWhen(Short,DTSL,1);
BuySL=ValueWhen(Buy,DTSL,1);
BuyDifference= BuyPrice - BuySL;
SellDifference = SellSL - SellPrice;

//tar1 = IIf(Buy OR Long AND NOT Relax AND NOT Sell AND NOT Cover, (BuyPrice + BuyDifference), (SellPrice - SellDifference));
//tar2 = IIf(Buy OR Long AND NOT Relax AND NOT Sell AND NOT Cover, (BuyPrice + (2*BuyDifference)), (SellPrice - (2*SellDifference)));
//tar3 = IIf(Buy OR Long AND NOT Relax AND NOT Sell AND NOT Cover, (BuyPrice + (4*BuyDifference)), (SellPrice - (4*SellDifference)));
buyach1 = IIf((Buy OR Long AND NOT Relax AND NOT Cover AND NOT Short AND NOT Shrt), H > tar1, 0);
buyach2 = IIf((Buy OR Long AND NOT Relax AND NOT Cover AND NOT Short AND NOT Shrt), H > tar2 , 0);
buyach3 = IIf((Buy OR Long AND NOT Relax AND NOT Cover AND NOT Short AND NOT Shrt), H > tar3, 0);

sellach1 = IIf((Short OR Shrt AND NOT Relax AND NOT Sell AND NOT Buy AND NOT Long), L < tar1 , 0);
sellach2 = IIf((Short OR Shrt AND NOT Relax AND NOT Sell AND NOT Buy AND NOT Long), L < tar2, 0);
sellach3 = IIf((Short OR Shrt AND NOT Relax AND NOT Sell AND NOT Buy AND NOT Long), L < tar3, 0);


// User-defined parameter for EMA periods

EMA_Type		= Param("EMA-1, TEMA-2, JMA-3", 2, 1, 3, 1);
EMA_prds 		= Param("EMA_periods", 7, 1, 30, 1);
Std_MACD		= Param("Standard MACD? No-0, Yes-1", 1, 0, 1, 1);
Plot_fashion	= Param("Bar+Arrows-1, Impulse  Bars-2", 2, 1, 2, 1);


// Allow user to define Weekly and Monthly Ribbon Location and Height
WR_P1 = Param("Weekly Ribbon Location", -10.5, -1000, 1000, 0.1);
WR_P2 = Param("Weekly Ribbon Height", 366.5, -0.001, 500, 0.1);

MR_P1 = Param("Monthly Ribbon Location", 5.2, -1000, 1000, 0.1);
MR_P2 = Param("Monthly Ribbon Height", 199, -0.001, 500, 0.1);


// Compute EMA and MACD Histogram
if(EMA_Type == 1)
{
	DayEMA	= EMA(Close, EMA_prds);
}
if (EMA_Type == 2)
{
	DayEMA	= TEMA(Close, EMA_prds);
}

if(EMA_Type == 3)
{
	// Line below to be used with Jurik JMA
	// DayEMA = JurikJMA(C, EMA_Prds);
}

Histogram	= MACD() - Signal();

// Determine if we have an Impulse UP, DOWN or None
Impulse_Up		=	DayEMA > Ref(DayEMA, -1) AND Histogram > Ref(Histogram, -1);
Impulse_Down	=	DayEMA < Ref(DayEMA, -1) AND Histogram < Ref(Histogram, -1);
Impulse_None		=	(NOT Impulse_UP) AND (NOT Impulse_Down);

// Compute Weekly MACD and determine whether rising or falling
// Note: uses "non-standard"  parameters!
TimeFrameSet(inWeekly);

if (Std_MACD == 0)
{
MACD_val		=	MACD(5, 8);
Signal_val		=	Signal(5, 8, 5);
}
else
{
MACD_val		=	MACD(12, 26);
Signal_val		=	Signal(12, 26, 9);
}

Hist_in_w		=	MACD_val - Signal_val;

wh_rising = Hist_in_w > Ref(Hist_in_w, -1);
wh_falling = Hist_in_w < Ref(Hist_in_w, -1);

TimeFrameRestore();

// Now get Monthly MACD Histogram....
TimeFrameSet(inMonthly);
MACD_val		=	MACD(5, 8);
Signal_val		=	Signal(5, 8, 5);
Hist_in_m		=	MACD_val - Signal_val;

mh_rising = Hist_in_m > Ref(Hist_in_m, -1);
mh_falling = Hist_in_m < Ref(Hist_in_m, -1);

TimeFrameRestore();

wh_rising 		= TimeFrameExpand( wh_rising, inWeekly, expandLast );
wh_falling 		= TimeFrameExpand( wh_falling, inWeekly, expandLast);
mh_rising 	= TimeFrameExpand(mh_rising, inMonthly, expandLast);
mh_falling 	= TimeFrameExpand(mh_falling, inMonthly, expandLast);

kol 	= IIf( wh_rising, colorGreen,  IIf(wh_falling, colorRed,
colorLightGrey));
mkol 	= IIf( mh_rising, colorBlue,  IIf(mh_falling, colorYellow,
colorLightGrey));

// Plot them all!
if (Plot_fashion == 1)
{
	Plot(Close, "Close", colorTeal, styleBar);
	PlotShapes(shapeUpArrow * Impulse_Up, colorBlue, 0, Low, -12);
	PlotShapes(shapeDownArrow * Impulse_Down, colorRed, 0, High, -12);
	PlotShapes(shapeSmallCircle * Impulse_None, colorWhite, 0, High, 5);
}
else
{
	bar_kol	=	IIf(impulse_UP, colorBlue, IIf(impulse_Down, colorRed,
colorWhite));
	//Plot(C, "Close", bar_kol, styleBar);
}

Plot(10, "ribbon", kol, styleOwnScale|styleArea|styleNoLabel, WR_P1, WR_P2);//Weekly trend

Plot(10, "ribbon", mkol, styleOwnScale|styleArea|styleNoLabel, MR_P1,
MR_P2);	// Monthly Trend

// Explorer Section
// Determine if Impulse status is bullish, neutral or bearish.  Display as Text Column.

Impulse_State		=	WriteIf(Impulse_Up, "Bul", WriteIf(Impulse_Down,
"Bear", "Neut"));

// Set the background color for Impulse Status Column
Impulse_Col		=	IIf(Impulse_Up, colorGreen, IIf(Impulse_Down, colorRed,
colorLightGrey));

// Determine Weekly Trend. Display as Text Column
Weekly_Trend		=	WriteIf(wh_rising, "Rising", WriteIf(wh_falling, "Falling",
"Flat!"));
Weekly_Col		=	IIf(wh_rising, colorGreen, IIf(wh_falling, colorRed,
colorLightGrey));

// Determine Monthly Trend. Display as Text Column
Monthly_Trend	=	WriteIf(mh_rising, "Rising", WriteIf(mh_falling, "Falling",
"Flat!"));
Monthly_Col		=	IIf(mh_rising, colorGreen, IIf(mh_falling, colorRed,
colorLightGrey));

// Determine how many bars has the current state existed
bars_in_bull	=	Min(BarsSince(impulse_none), BarsSince(impulse_down));
bars_in_bear	=	Min(BarsSince(impulse_up), BarsSince(impulse_none));
bars_in_neut	=	Min(BarsSince(impulse_down), BarsSince(impulse_up));

// Set a single variable to show number of bars in current state depending upon

// actual Impulse Status - Bullish, Bearish or Neutral
bars_in_state	=	IIf(Impulse_Up,bars_in_bull, IIf(Impulse_down, bars_in_bear,bars_in_neut));
//AddColumn(Close,"Close",1.2);
// Columns for display in Explorer
//AddTextColumn(Impulse_State, "Status", 1, colorWhite, Impulse_Col);
//AddColumn(bars_in_state, "Bars", 1, colorWhite, Impulse_col);
//Action = WriteIf(Buy, "BUY", WriteIf(Sell, "SELL", "   "));
//i=0;
//bars_in_statee	=	IIf(Buy, BarCount[i], IIf(Sell, BarCount[i],bars_in_neut));
//bars=BarsSince(IIf(Buy+BarCount+1),OR( Sell-BarCount+1));

plus= Param("plus", 0.8,0,52,1);
Minus = Param("Minus", -0.8,-15,-0,-20);
prch = (C- TimeFrameGetPrice( "C", inDaily, -1 ))/ TimeFrameGetPrice( "C", inDaily, -1 )*100 ;
prcha= (C-Ref(C,-6))/Ref(C,-6)*100;
prche= (C-Ref(C,-2))/Ref(C,-1)*100;
prchjk= (C-Ref(C,-2))+Ref(C,-1)*10/1;
//prchjka=(prchjk)/10;

prchjka = (C+ TimeFrameGetPrice( "C", inDaily, -1 ))- Close;

//Date()
//prchjk= (Date()-Ref(Date(),-1))+Ref(Date(),-1);
prch5=(prche-prch);
prch6= (C-Ref(C,-5))/Ref(C,-5)*100;
prch7= (C-Ref(C,-29))/Ref(C,-29)*100;
prch8= (C-Ref(C,-87))/Ref(C,-87)*100;
prch9= (C-Ref(C,-150))/Ref(C,-150)*100;
prch10= (C-Ref(C,-254))/Ref(C,-252)*100;
prch11= (C-Ref(C,-490))/Ref(C,-490)*100;
prch12= (C-Ref(C,-735))/Ref(C,-735)*100;
prch13= (C-Ref(C,-1283))/Ref(C,-1283)*100;


col=IIf ((Volume > 1.25 * EMA( Volume, 34 )),colorRed,colorLime);
//Col=IIf(( Buy, 66 , 83 ),  formatChar, colorDefault, IIf( plus , colorGreen, colorRed ));

//Filter = prch6 <3 OR prch6  <-3 ;
if(prexplore==0)
{Filter = prch > plus OR prch  < Minus  ;
AddColumn(prchjka ,"prvClose",colorDefault,Col,colorPlum);
AddColumn(Close,"Close",1.2,colorDefault, Col);
AddColumn(prch5,"prviday", 1.2,colorDefault, Col);
AddColumn(prch,"daily", 1.2,colorDefault, Col);
//Filter=0;
AddColumn( IIf( Buy, 66 , 83 ), "Signal", formatChar, colorDefault, IIf( Buy , colorGreen, colorRed ) );

AddColumn(Volume,"Volume",1.0, colorDefault, IIf ((Volume > 1.25 * EMA( Volume, 34 )),colorCustom12,colorLime));
AddColumn(prch6,"weekly", 1.2,colorDefault, Col);
AddColumn(prch7,"monthly", 1.2,colorDefault, Col);
AddColumn(prch8,"qutrly", 1.2,colorDefault, Col);
AddColumn(prch9,"halfyly", 1.2,colorDefault, Col);
AddColumn(prch10,"yearly", 1.2,colorDefault, Col);
AddColumn(prch11,"twoyrly", 1.2,colorDefault, Col);
AddColumn(prch12,"thirdyrly", 1.2,colorDefault, Col);
AddColumn(prch13,"fiveyrly", 1.2,colorDefault, Col);

}
else
{

//Filter =  Sell>-2 AND i<-3 OR Buy>2 AND i<3 ;
AddColumn(ROC(V,1),"RVol ",1.2, IIf(ROC(V,1) > 0,colorDefault,colorYellow),Impulse_col);

AddColumn(bars_in_state ,"Bars", 1, colorWhite, Impulse_col);
prchjka = (C+ TimeFrameGetPrice( "C", inDaily, -1 ))- Close;

//AddColumn(C + C +1 ,"Close",1.2,colorDefault, Col)/2;
AddColumn(prchjka ,"prvClose",colorDefault,colorWhite, colorBlue);
//AddTextColumn(Weekly_Trend, "W Trend", 1, colorWhite, Weekly_Col);
//AddTextColumn(Monthly_Trend, "M Trend", 1, colorWhite, Monthly_Col);

//Filter = 1;

_SECTION_END();
//Settings for exploration

H1 = SelectedValue( TimeFrameGetPrice( "H", inDaily, -1 ) );
L1 = SelectedValue( TimeFrameGetPrice( "L", inDaily, -1 ) );
C1 = SelectedValue( TimeFrameGetPrice( "C", inDaily, -1 ) );
H2 = SelectedValue( TimeFrameGetPrice( "H", inDaily, 0 ) );
L2 = SelectedValue( TimeFrameGetPrice( "L", inDaily, 0 ) );
O1 = SelectedValue( TimeFrameGetPrice( "open", inDaily, 0 ) );
F4 = 0;
D1 = ( H1 - L1 );
D2 = ( H2 - L2 );
F1 = D1 * 0.433;
F2 = D1 * 0.766;
F3 = D1 * 1.35;
if ( D2 <= F1 )
    F4 = F1;
else
    if ( D2 <= F2  )
        F4 = F2;
    else
        F4 = F3;

S_P = ( O1 - F4 );

B_P = ( O1 + F4 );

BP = ( L2 + F4 );

BPTGT = ( BP + ( BP * .0065 ) );//.0015 brokerage

BPSTPLS = ( BP - ( BP * .0085 ) );

SP = ( H2 - F4 );

SPTGT = ( SP - ( SP * .0065 ) );

SPSTPLS = ( SP + ( SP * .0085 ) );


p = ( H1 + L1 + C1 ) / 3;

s1 = ( H1 );

r1 = ( L1 );

r2 = SelectedValue( L2 );

s2 = SelectedValue( H2 );

//CONDITION

if (ParamToggle("Tooltip shows", "All Values|Only Prices"))
{
  ToolTip = StrFormat("Open: %g\nHigh:  %g\nLow:   %g\nClose:  %g (%.1f%%) \nVolume: " + NumToStr(V, 1), O, H, L, C, SelectedValue(ROC(C, 1)));
}

//space = Param("Space on Chart", 20,  - 15, 50, 1);
//GraphXSpace = space;
//SetChartBkColor(ParamColor("Background Color", colorBlack));

// ================= Rasheed's original code (with Lookback and Shift default set to his specs) =================

H0 = H;
L0 = L;
C0 = C;
O0 = O;

Lookback = Param("LookBack", 10, 10, 50, 1); // Default for interday commodity currency trading
shift = Param("Shift", 5, 1, 50, 1); // ?
x0 = LastValue(Cum(1));
x1 = x0 - shift;
H = Ref(H,  - shift + 1);
L = Ref(L,  - shift + 1);
H1 = LastValue(Ref(HHV(H, Lookback),  - 1));
L1 = LastValue(Ref(LLV(L, Lookback),  - 1));

//Plot(H1, "H1", colorYellow);
//Plot(L1, "L1", colorYellow);

H = H0;
L = L0;
C = C0;
O = O0;

up = Cross(H, H1)AND Cum(1) > x1;
dn = Cross(L1, L)AND Cum(1) > x1;

//Plot(C, "Close", IIf(Cum(1) > x1 - Lookback AND Cum(1) <= x1, colorBlue, IIf(Up, colorBrightGreen, IIf(Dn, colorRed, IIf(C > O, colorGreen, colorRed)))), 64);
//PlotShapes(shapeDownArrow *(Cum(1) == x1 + 1), colorBlue);

// ======================= Exploration and Signal Code =================
TRIGGER = ParamToggle("Trigger ", "CLOSE|HIGH OR LOW");


XH1 = Cross(C, H1);
XL1 = Cross(L1, C);
XH2 = Cross(H, H1);
XL2 = Cross(L1, L);

if (TRIGGER == 0)
{
  //Buy = XH1;
  //Sell = XL1;
}

else
{
  //Buy = XH2;
  //Sell = XL2;
}


//TradeDisplay = ParamToggle("Remove Extra Trades?", "No|Yes");

//if(TradeDisplay != 0){
	//Buy = ExRem(Buy, Sell);
  	//Sell = ExRem(Sell, Buy); // THIS WILL REMOVE EXESS SIGNALS ON A CHART OR IN AN EXPLORATION
//}

//Filter =  Buy >2 <3 == BarCount+1 OR Sell >-3<-3 == BarCount+1;
Action = WriteIf(Buy, "BUY", WriteIf(Sell, "SELL", "   "));

//AddTextColumn(IndustryID(1), "Industry Sector  ", 30.0, colorBlue, colorYellow);
AddColumn(C, "Entry ", 2.2, colorWhite, colorBlue);
AddTextColumn(Action, "Action", 8.0, IIf(xh1, colorDarkGreen, colorDarkRed), colorYellow);
AddColumn(IIf(XH1, H1, L1), "BREAKOUT LEVEL", 3.2, colorYellow, IIf(XH1, colorDarkGreen, colorDarkRed));

// -----------------------------------------------------------------------------------  Arrow signals --- FOR TRADES  ----------------------------------------------------------
//PlotShapes(Buy *shapeUpArrow, colorBrightGreen, 0, L /* ENTRY_TRAILARRAY */,  - 30);
//PlotShapes(Sell *shapeDownArrow, colorLightYellow, 0, H,  - 30);
_SECTION_END();


_SECTION_BEGIN("Volume At Price");
PlotVAPOverlay(Param("Lines", 1000, 100, 1000, 10), Param("Width", 15, 1, 100, 1), ParamColor("Color", colorBlue), ParamToggle("Side", "Left|Right", 1) | 4 *ParamToggle("Z-order", "On top|Behind", 1));

_SECTION_END();
//Filter =  Buy OR Sell;

//AddColumn( IIf( Buy, 66, 1 ), "Buy", formatChar, 1, bkcolor = IIf( Buy, 43, 33 ) );

//AddColumn( IIf( Sell, 83, 1 ), "Sell", formatChar, 1, bkcolor = IIf( Sell, 25, 32 ) );


//AddColumn( C, "CMP", 1.2, colorDefault, colorLightBlue );

//AddColumn( BP, "SELL PRICE", 1.2, colorDefault, colorGreen );

//AddColumn( BPTGT, "TGT PRICE", 1.2, colorDefault, colorBrown );

//AddColumn( BPSTPLS, "STPLS BUY", 1.2, colorDefault, colorRed );

AddColumn( p, "PIVOT", 1.2, colorDefault, colorYellow );

//AddColumn( SPSTPLS, "STPLS SELL", 1.2, colorDefault, colorRed );

//AddColumn( SP, "SELL PRICE", 1.2, colorDefault, colorGreen );

//AddColumn( SPTGT, "TGT PRICE", 1.2, colorDefault, colorBrown );


//Settings for exploration

Filter=Buy OR Short;
AddColumn( IIf( Buy, 66 , 83 ), "Signal", formatChar, colorDefault, IIf( Buy , colorGreen, colorRed ) );

//AddColumn(Close,"Entry Price",1.4, colorDefault, IIf( Buy , colorGreen, colorRed ));
AddColumn(dtsl,"Stop Loss",1.4, colorDefault, IIf( Buy , colorGreen, colorRed ));
AddColumn(tar1,"Target 1",1.4, colorDefault, IIf( Buy , colorGreen, colorRed ));
AddColumn(tar2,"Target 2",1.4, colorDefault, IIf( Buy , colorGreen, colorRed ));
AddColumn(tar3,"Target 3",1.4, colorDefault, IIf( Buy , colorGreen, colorRed ));
AddColumn(Volume,"Volume",1.0, colorDefault, IIf ((Volume > 1.25 * EMA( Volume, 34 )),colorBlue,colorYellow));
AddColumn( H1, "PRE-HIGH" );

AddColumn( L1, "PRE-LOW" );

AddColumn( D1, "PRE-DIFF" );

AddColumn( F1, "0.433" );

AddColumn( F2, "0.766" );

AddColumn( F3, "1.35" );

AddColumn( H2, "D-HIGH" );

AddColumn( L2, "D-LOW" );

AddColumn( D2, "D-DIFF" );

AddColumn( F4, "SELECT FACT" );

//AlertIf( Buy , "SOUND C:\\Windows\\Media\\chimes.wav", "Audio alert", 2 );
//AlertIf( Sell , "SOUND C:\\Windows\\Media\\alert.wav", "Audio alert", 2 );

}
//Short = Sell;
//Cover = Buy;

//Short = ExRem(Short, Cover);
//Cover = ExRem(Cover, Short);


if(messageboard)
{
for( i = 0; i < BarCount; i++ )
{
    if( Buy[i] )
    {
        // PlotText( "\nBuy:" + L[ i ] + "\nT= " + (L[i]*1.005) + "\nSL= " + (L[i]*0.9975), i, L[ i ]-dist[i], colorGreen, colorWhite );

        // Signal Display Panel //

       SellPrice=ValueWhen(Sell,C,1);
       BuyPrice=ValueWhen(Buy,L[ i ]);
       Long=Flip(Buy,Sell);
        Shrt=Flip(Sell,Buy );
        BuyStop2 = L[i]*0.9975;
        BuyTP1 = L[i]*1.070;
        BuyTP2 = L[i]*1.050;
        BuyTP3 = L[i]*1.035;
buyach1 = IIf((Buy OR Long AND NOT Relax AND NOT Cover AND NOT Short AND NOT Shrt), H > BuyTP3, 0);
buyach2 = IIf((Buy OR Long AND NOT Relax AND NOT Cover AND NOT Short AND NOT Shrt), H > BuyTP2, 0);
buyach3 = IIf((Buy OR Long AND NOT Relax AND NOT Cover AND NOT Short AND NOT Shrt), H > BuyTP1, 0);
        GfxSelectFont( "Tahoma", 13, 100 );
        GfxSetOverlayMode( mode = 0 );
        GfxSelectPen( colorBrightGreen, 3 );
        GfxSelectSolidBrush( colorBrightGreen);
        GfxRoundRect( x, y - 163, x2, y , 7, 7 ) ;
       GfxSetTextColor( colorGold );
       GfxTextOut( ( " Trading System "),73,y-165);
        GfxTextOut( (" "),27,y-160);
        GfxSetBkMode(1);
        GfxSelectFont( "Arial", 10, 700, False );
        GfxSetTextColor( colorBlue );
        GfxSetTextAlign(0);
        GfxSelectFont( "Tahoma", 13, 100 );
//GfxTextOut( WriteIf(BuyTP1, "Buy TGT1: "+(BuyTP3),""), 13,y- 100);

   GfxTextOut( WriteIf(L[ i ], "Buy Above: "+L[ i ],""), 13, y-140);
   GfxSetTextColor( colorGold );
   GfxTextOut( WriteIf(BuyStop2, "Long SL: "+(BuyStop2),""), 13, y-120);
   GfxSetTextColor( colorWhite );
   GfxTextOut( WriteIf(BuyTP1, "Buy TGT1: "+(BuyTP3),""), 13,y- 100);
   GfxTextOut( WriteIf(BuyTP2, "Buy TGT2: "+(BuyTP2),""), 13,y- 80);
   GfxTextOut( WriteIf(BuyTP3, "BuyTGT3: "+(BuyTP1),""), 13,y- 60);
   GfxSetTextColor( colorViolet );
   GfxTextOut( ("Current P/L : " + WriteVal(IIf(Buy ,(C-BuyPrice),(C-BuyPrice)),2.2)), 88, y-22);
  GfxTextOut( ("Buy  Signal came " + (BarCount-bars +1) * Interval()/3 + " mins ago"), 13, y-40) ;
GfxTextOut
( ("" + WriteIf (buyach1, " Done: "+BuyTP3,"")), 160, y-100);
GfxTextOut
( ("" + WriteIf (buyach2, " Done: "+BuyTP2,"")), 160, y-80);
GfxTextOut
( ("" + WriteIf (buyach3, " Done: "+BuyTP1,"")), 160, y-60);
        // END of Signal Display Panel //
    }
    if( Sell[i] )
    {
//GfxTextOut( WriteIf(BuyTP1, "Buy TGT1: "+(BuyTP3),""), 13,y- 100);
   //GfxTextOut( WriteIf(Sell, "Buy TGT2: "+Sell,""), 13,y- 80);
        // PlotText( "Sell:" + H[ i ] + "\nT= " + (H[i]*0.995) + "\nSL= " + (H[i]*1.0025), i, H[ i ]+dist1[i], colorRed, colorWhite );

        // Signal Display Panel //
        SellPrice=ValueWhen(Sell,C,1);
BuyPrice=ValueWhen(Buy,H[ i ]);
Long=Flip(Buy,Sell);
Shrt=Flip(Sell,Buy );
       SellStop2 = H[i]*1.0025;
        SellTP1 = H[i]*0.978;
        SellTP2 = H[i]*0.982;
        SellTP3 = H[i]*0.988;
sellach1 = IIf((Short OR Shrt AND NOT Relax AND NOT Sell AND NOT Buy AND NOT Long), L < SellTP3 , 0);
sellach2 = IIf((Short OR Shrt AND NOT Relax AND NOT Sell AND NOT Buy AND NOT Long), L < SellTP2, 0);
sellach3 = IIf((Short OR Shrt AND NOT Relax AND NOT Sell AND NOT Buy AND NOT Long), L < SellTP1, 0);

        GfxSelectFont( "Tahoma", 13, 100 );
        GfxSetOverlayMode( mode = 0 );
        GfxSelectPen( colorRed, 3 );
        GfxSelectSolidBrush( colorRed );
         GfxRoundRect( x, y - 163, x2, y , 7, 7 ) ;

        GfxTextOut( (" "),27,y-160);
        GfxSetBkMode(1);
        GfxSelectFont( "Arial", 10, 700, False );
        GfxSetTextColor( colorWhite );
        GfxSetTextAlign(0);
        GfxSelectFont( "Tahoma", 13, 100 );
        GfxSetTextColor( colorGold );
        GfxTextOut( ( " Trading System "),73,y-165);
        GfxSetTextColor( colorWhite );
       GfxTextOut( WriteIf(H[ i ], "Sell Below: "+H[ i ],""), 13, y-140);
       GfxSetTextColor( colorGold );
       GfxTextOut( WriteIf(SellStop2, "Short SL: "+(SellStop2),""), 13, y-120);
       GfxSetTextColor( colorBlue );
       GfxTextOut( WriteIf(SellTP1, "Short TGT1: "+(SellTP3),""), 13, y-100);
       GfxTextOut( WriteIf(SellTP2, "Short TGT2: "+(SellTP2),""), 13, y-80);
       GfxTextOut( WriteIf(SellTP3, "Short TGT3: "+(SellTP1),""), 13, y-60);
       GfxSetTextColor( colorGold );
       GfxTextOut( ("Current P/L : " + WriteVal(IIf(Sell ,(SellPrice-C),(SellPrice-C)),2.2)), 88, y-22);
        GfxTextOut( ("sell Signal came " + (BarCount-bars +1) * Interval()/1 + " mins ago"), 13, y-40) ;
       GfxTextOut
( ("" + WriteIf (sellach1, "  Done: "+SellTP3,"")), 160, y-100);
GfxTextOut
( ("" + WriteIf (sellach2, "  Done: "+SellTP2,"")), 160, y-80);
GfxTextOut
( ("" + WriteIf (sellach3, "  Done: "+SellTP1,"")), 160, y-60);
// END of Signal Display Panel //
    }}}


for( i = 0; i < BarCount; i++ )
{
 if( Buy[i] )
 {

OUTcolor = ParamColor("Outer Panel Color",colorTeal);
INUPcolor = ParamColor("Inner Panel Upper",colorDarkGreen);
INDNcolor = ParamColor("Inner Panel Lower",colorDarkOliveGreen);
TitleColor = ParamColor("Title Color ",colorBlack);
SetChartBkColor(OUTcolor); // color of outer border
SetChartBkGradientFill(INUPcolor,INDNcolor,TitleColor); // color of inner panel
}
if( Sell[i] )
{

OUTcolor = ParamColor("Outer Panel Color",colorTeal);
INUPcolor = ParamColor("Inner Panel Upper2",colorDarkRed);
INDNcolor = ParamColor("Inner Panel Lower2",colorPlum);
TitleColor = ParamColor("Title Color ",colorBlack);
SetChartBkColor(OUTcolor); // color of outer border
SetChartBkGradientFill(INUPcolor,INDNcolor,TitleColor); // color of inner panel
}
}


_SECTION_BEGIN("Pivot calc");
pd = Param("Periods",13,5,144,1);
pds = 2*pd-1;//     (Adjustment for Wilders MA)
aa = Close-Ref(Close,-1);
uu = EMA(Max(0,aa),pds);
dd=  EMA((Max(0,0-aa)),pds);

rf = IIf(C>2,1000,10000);

c1 = Param("Upper Level",70,50,90,1);
qq1 =100/(100-c1)-1;
ff1 = qq1*dd-uu;
ff2 = ff1/qq1;
f1 = Max(ff1,ff2);
UL = Close + f1*(pds-1)/2;
UL = IIf(UL>C,floor(UL*rf),ceil(UL*rf))/rf;

c2 = Param("Equilibrium",50,50,50,0);
qq2 =100/(100-c2)-1;// [=1]
ff = dd-uu;
MM = Close + ff*(pds-1)/2;
MM = IIf(MM>C,floor(MM*rf),ceil(MM*rf))/rf;

c3 = Param("Lower Level",30,10,50,1);
qq3 =100/(100-c3)-1;
ff1 = qq3*dd-uu;
ff2 = ff1/qq3;
f3 = Min(ff1,ff2);
LL = Close + f3*(pds-1)/2;
LL = IIf(LL>C,floor(LL*rf),ceil(LL*rf))/rf;

band = Param("band width",4,0,15,0.25);
mmu = MM+band;
mmd = MM-band;


X=Cross( C,LL);
Y=Cross(UL,C);

Buy1= X ;
Sell1= Y ;

TimeFrameSet( in15Minute*2 );
DH=Ref(H,-1);
DL=Ref(L,-1);
DC=Ref(C,-1);


pd = ( DH+ DL + DC )/3;
sd1 = (2*pd)-DH;
sd2 = pd -(DH - DL);
sd3 = Sd1 - (DH-DL);
rd1 = (2*pd)-DL;
rd2 = pd +(DH -DL);
rd3 = rd1 +(DH-DL);

TimeFrameRestore();

_SECTION_END();


Title =
EncodeColor(colorWhite)+  Name() + " - " + EncodeColor(colorRed)+ Interval(2)
+ EncodeColor(colorWhite) +  "  - " + Date() +" - "
+"\n"

+EncodeColor(colorYellow) +"Op-"+O+"  "+"Hi-"+H+"  "+"Lo-"+L+"  "+ "Cl-"+C+"  "+ "Vol= "+ WriteVal(V)
//+ WriteIf ((e3>e45) ,EncodeColor(colorLime)+ "      Direction : LONG",EncodeColor(colorRed)+"      Direction : SHORT")
+"\n"
+ WriteIf (Sell , " EXIT LONG / Reverse Signal at "+C+"\n","")
+ WriteIf (Buy , " EXIT SHORT / Reverse Signal at "+C+"\n","")

+WriteIf(Sell , "Total Profit / Loss for the Last Trade Rs."+(C-BuyPrice)+"","")+
WriteIf(Buy , "Total Profit / Loss for the Last trade Rs."+(SellPrice-C)+"","")+
WriteIf(Long AND NOT Buy,EncodeColor(colorLime)+  "Trade : Long - Entry price Rs."+(BuyPrice)+" Tgt : "+UL,"")+
WriteIf(shrt AND NOT Sell,EncodeColor(colorRed)+ "Trade : Short - Entry price Rs."+(SellPrice)+" Tgt : "+LL,"")+"\n"+
WriteIf(Long AND NOT Buy, "Current Profit / Loss Rs."+(C-BuyPrice)+"","")+
WriteIf(shrt AND NOT Sell, "Current Profit / Loss Rs."+(SellPrice-C)+"","")
+ EncodeColor(colorBrightGreen)+   "\n R3 : "+ EncodeColor(colorWhite)+RD3
+ EncodeColor(colorBrightGreen)+   "\n R2 : "+ EncodeColor(colorWhite)+RD2
+ EncodeColor(colorBrightGreen)+   "\n R1 : "+ EncodeColor(colorWhite)+RD1 + EncodeColor(colorBrightGreen)+  "     UP TGT   : "+ EncodeColor(colorWhite)+UL
+ EncodeColor(colorBlue)+   "\n Pivot : "+ EncodeColor(colorWhite)+pd+ EncodeColor(colorBlue)+   "     MIDPOINT : "+ EncodeColor(colorWhite)+MM
+ EncodeColor(colorRed)+   "\n S1 : "+ EncodeColor(colorWhite)+SD1   + EncodeColor(colorRed)+    "     BOT TGT  : "+ EncodeColor(colorWhite)+LL
+ EncodeColor(colorRed)+   "\n S2 : "+ EncodeColor(colorWhite)+SD2
+ EncodeColor(colorRed)+   "\n S3 : "+ EncodeColor(colorWhite)+SD3;

if(bslable==0)
{
dist = 1.0*ATR(10);
dist1= 2.0*ATR(10);
for( i = 0; i < BarCount; i++ )
{
if( Buy[i] )
{
//PlotText( WriteVal(H[ i ],1.3) + "\n" + WriteVal(C[i],1.2), i, L[ i ]-dist[i], colorLime, colorBlack );
PlotText( WriteVal(L[ i ],1.2), i, L[ i ]-dist[i], colorBlue, colorWhite );
}
if( Sell[i] )
{
//PlotText( "" + WriteVal(L[ i ],1.3)+ "\n" + WriteVal(C[i],1.2), i, H[ i ]+dist1[i], colorRed, colorBlack );
PlotText( WriteVal(H[ i ],1.2), i, H[ i ]+dist1[i], colorRed, colorWhite );
}}}


//if (EndValue(Buy)==1) Say("strong Buy go long dear",-1);
//if (EndValue(Sell)==1) Say("strong Sell go short dear",-1);
//if (EndValue(Cover)==1) Say(" go long dear");
//if (EndValue(Short)==1) Say(" go short dear");
7 comments
Leave Comment
Please login here to leave a comment.
thanks to admin for great work its all thanks for admin….enjtrd…
Waiting for AFL
Please correct Ln: 41, Col: 1
line no. 37 and 41 maybe helped
WriteIf(Buy, "YOU BUY “,”")
WriteIf(Sell, "YOU SELL “,”")
error on line 41
some modification done…
download link
http://www.mediafire.com/download/t044swhysy8lomj/aflmb.zip
password=== 12345
Not work coorectly. Please coorect Line 41 againe.