DODA BAND BUY SELL for Amibroker (AFL)
saas about 13 years ago Amibroker (AFL)
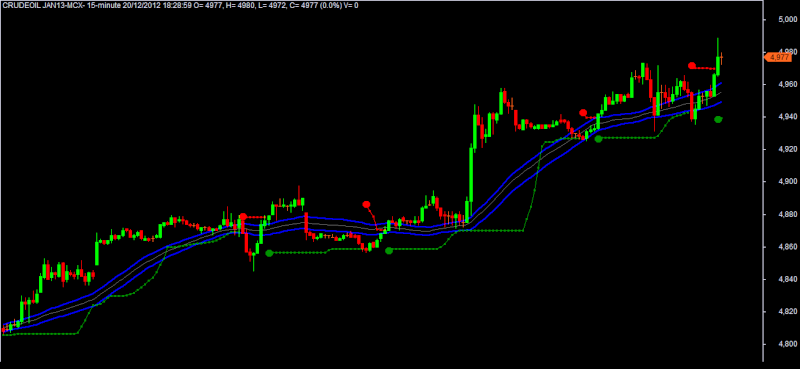
Doda Band AFL Code
Red Signal Sell
Green Signal Buy
15 minutes chart try good
Screenshots
Indicator / Formula
Copy & Paste Friendly
_SECTION_BEGIN("Price Chart");
bgTop = ParamColor("BgTop", colorBlack);
bgBot = ParamColor("BgBottom", colorBlack);
SetChartBkGradientFill( bgTop ,bgBot, colorBlack);

pStyle = ParamList("Price Style", "Candle|Solid Candle|Bar|Line|Heikin-Ashi",2);
cBull = ParamColor("Price Bull", colorBrightGreen);
CBear = ParamColor("Price Bear", colorRed);
cLine = ParamColor("Price Line", colorOrange);

SetChartOptions(0,chartShowArrows|chartShowDates);
_N(Title = StrFormat("{{NAME}}- {{INTERVAL}} {{DATE}} O= %g, H= %g, L= %g, C= %g (%.1f%%) V= " +WriteVal( V, 1.0 ) +"\n{{VALUES}}", O, H, L, C,

SelectedValue( ROC( C, 1 )) ));

ThisStyle = styleCandle;
ThisTitle = "";

_O=O; _C=C; _H=H; _L=L;

ThisColor = IIf( _C>_O, cBull, IIf(_C<_O, CBear, CLine));


switch (pStyle )
{

case "Solid Candle":
SetBarFillColor( ThisColor );
break;


case "Bar":
ThisStyle = styleBar;
break;

case "Line":
ThisStyle = styleLine;
ThisColor = cLine;
break;


case "Heikin-Ashi":
_C = (O+H+L+C)/4;
_O = AMA( Ref( _C, -1 ), 0.5 );
_H = Max( H, Max( _C, _O ) );
_L = Min( L, Min( _C, _O ) );

ThisColor = IIf(_C >= _O,CBull, CBear);
SetBarFillColor( ThisColor );

ThisColor = IIf(_C >= _O,cLine, cLine);
ThisTitle = "Heikin-Ashi";
break;

default:
SetBarFillColor( ThisColor );
ThisColor = cLine;

break;

}

PlotOHLC( _O, _H, _L, _C, ThisTitle, ThisColor, ThisStyle);
GraphXSpace = 8;

_SECTION_END();


_SECTION_BEGIN("BandStop");
/* Done by Rajandran R */
/* Author of www.marketcalls.in */
// BBands_Stop_v1.mq4 by igorad2004@list.ru
// translation in Amibroker AFL, E.M.Pottasch, 2011

// Modified By KelvinHand

Length=Param("Length",20, 2); // Bollinger Bands Period
Deviation=Param("Deviation",2);
// Deviation was 2
MoneyRisk=Param("Money Risk", 1);

LineStyle=ParamToggle("Display line mode", "No|Yes", 1); // Display line mode: 0-no,1-yes
cUpTrendLine = ParamColor("UpTrendLine", colorGreen);
cDnTrendLine = ParamColor("DownTrendLine", colorRed);

// Offset Factor
TurnedUp=Nz(StaticVarGet("TurnedUp"));
TurnedDown=Nz(StaticVarGet("TurnedDown"));
SoundON = ParamToggle("Sound","Off|On",1);


procedure CalcTrend_proc(bbtop,bbbot,Length,MoneyRisk,SoundON,TurnedUp,TurnedDown)
{
global UpTrendLine;
global DownTrendLine;
global smax;
global smin;

UpTrendLine=Null;
DownTrendLine=Null;
smax=Null;
smin=Null;
trend=0;


for (i=Length+1; i<BarCount; i++)
{
smax[i]=bbtop[i];
smin[i]=bbbot[i];
if (C[i]>smax[i-1]) trend=1;
if (C[i]<smin[i-1]) trend=-1;
if(trend>0 && smin[i]<smin[i-1]) smin[i]=smin[i-1];
if(trend<0 && smax[i]>smax[i-1]) smax[i]=smax[i-1];
bsmax[i]=smax[i]+0.5*(MoneyRisk-1)*(smax[i]-smin[i]);
bsmin[i]=smin[i]-0.5*(MoneyRisk-1)*(smax[i]-smin[i]);
if(trend>0 && bsmin[i]<bsmin[i-1]) bsmin[i]=bsmin[i-1];
if(trend<0 && bsmax[i]>bsmax[i-1]) bsmax[i]=bsmax[i-1];
if (trend>0)
{
UpTrendLine[i]=bsmin[i];
if (SoundON==True && !TurnedUp && i==BarCount-1 && IsEmpty(UpTrendLine[i-1]))
{
Say("Bollinger Bands going Up");
TurnedUp=StaticVarSet("TurnedUp",1);
TurnedDown=StaticVarSet("TurnedDown",0);

}
}

if (trend<0)
{
DownTrendLine[i]=bsmax[i];
if (SoundON==True && !TurnedDown && i==BarCount-1 && IsEmpty(DownTrendLine[i-1]))
{
Say("Bollinger Bands going Down");
TurnedUp=StaticVarSet("TurnedUp",0);
TurnedDown=StaticVarSet("TurnedDown",1);
}
} //if (trend<0)
} //for
} //procedure

bbtop=BBandTop(C,Length,Deviation);
bbbot=BBandBot(C,Length,Deviation);

CalcTrend_proc(bbtop,bbbot,Length,MoneyRisk,SoundON,TurnedUp,TurnedDown);
UpTrendSigNal=UpTrendLine AND IsEmpty(Ref(UpTrendLine,-1));
DownTrendSigNal=DownTrendLine AND IsEmpty(Ref(DownTrendLine,-1));

DisplayStyle = styleNoLabel|styleDots|styleNoTitle;
if(LineStyle == 0) DisplayStyle |= styleNoLine;


Plot(UpTrendLine,"UPTRENDLINE",cUpTrendLine,DisplayStyle);
Plot(DownTrendLine,"DOWNTRENDLINE",cDnTrendLine,DisplayStyle) ;

PlotShapes(IIf(UpTrendSignal,shapeCircle,shapeNone ),cUpTrendLine,0,bbbot,0);
PlotShapes(IIf(DownTrendSignal,shapeCircle,shapeNone),cDnTrendLine,0,bbtop,0);
_SECTION_END();

_SECTION_BEGIN("Wave Channel");

cOutLine = ParamColor("Outer Line", colorBlue);
cMidLine = ParamColor("Mid Line", colorGrey40);

Plot( MA(C, 34), "", cMidLine, styleNoLabel);
Plot( MA(H, 34), "", cOutLine, styleThick|styleNoLabel);
Plot( MA(L, 34), "", cOutLine, styleThick|styleNoLabel);

_SECTION_END();
2 comments
Leave Comment
Please login here to leave a comment.
SIR UR GREAT
Wonderful. Many Many Thanks.