good moving average for Amibroker (AFL)
amit pandey about 13 years ago Amibroker (AFL)
i find this from one of my friends
but this is very use ful in scalping
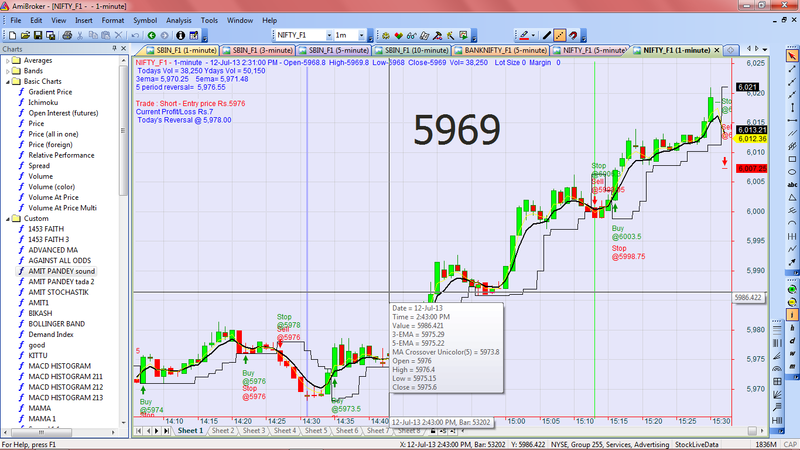
Screenshots
Indicator / Formula
Copy & Paste Friendly
_SECTION_BEGIN("MA Crossover Unicolor");

Plot(EMA(Close,3),"3-EMA",colorYellow,1);
Plot(EMA(Close,5),"5-EMA",colorBlack,4);

r=EMA(C,3);
a=EMA(C,5);


no=Param( "Swing", 5, 1, 55 );

res=HHV(H,no);
sup=LLV(L,no);
tsl=IIf(ValueWhen(IIf(C>Ref(res,-1),1,IIf(C<Ref(sup,-1),-1,0))!=0,IIf(C>Ref(res,-1),1,IIf(C<Ref(sup,-1),-1,0)),1)==1,sup,res);

Plot(tsl, _DEFAULT_NAME(), colorBlack, styleStaircase);
Buy = Cross(C,res) ;
Sell = Cross(sup,C)  ;
//PlotShapes (IIf(Buy,shapeUpArrow,shapeNone),colorYellow,0,Graph0,-15);
//PlotShapes (IIf(Sell,shapeDownArrow,shapeNone),colorCustom12,0,Graph0,-15);

_SECTION_END();

//GfxDrawText("5 period high low system", 4,12, 250, 40);

_SECTION_BEGIN("Price");
SetChartOptions(0,chartShowArrows|chartShowDates);

Plot( C, "Close", IIf(r>a,colorGreen,IIf(a>=r,colorRed,colorBlack)), styleCandle | styleThick );
_SECTION_END();
a=C;
g=(EMA(Close,3) * (2 / 4 - 1)-EMA(Close,5) * (2 / 6 - 1)) / (2 /4- 2 /6);
e=Ref(tsl,-1);
Buy = Cross(C,tsl) ;
Sell = Cross(tsl,C)  ;
SellPrice=ValueWhen(Sell,e,1);
BuyPrice=ValueWhen(Buy,e,1);
Long=Flip(Buy,Sell);
Shrt=Flip(Sell,Buy );
Filter=Buy OR Sell;
Buy = Cross(C,tsl) ;
Sell = Cross(tsl,C)  ;
shape = Buy * shapeUpArrow + Sell * shapeDownArrow;

PlotShapes( shape, IIf( Buy, colorGreen, colorRed ),0, IIf( Buy, Low, High ) );
a1=Ref(tsl,-1);
GraphXSpace = 5;
dist = 1.5*ATR(5);
for( i = 0; i < BarCount; i++ )
{if( Buy[i] ) PlotText( "Buy\n@" + a1[ i ], i, L[ i ]-dist[i], colorGreen );
if( Sell[i] ) PlotText( "Sell\n@" + a1[ i ], i, H[ i ]+dist[i],
colorRed);
}

GraphXSpace = 5;
dist = 2.5*ATR(5);
for( i = 0; i < BarCount; i++ )
{if( Buy[i] ) PlotText( "Stop\n@" + tsl[ i ], i, L[ i ]-dist[i], colorRed );
if( Sell[i] ) PlotText( "Stop\n@" + tsl[ i ], i, H[ i ]+dist[i],
colorGreen);
}
AddColumn( IIf( Buy, 66, 83 ), "Signal", formatChar );
AddColumn(C,"close",1.2);
AddColumn(e,"trade price",1.2);
gd=(Ref(EMA(C,5),-1)*(1-.3333)-Ref(EMA(C,3),-1)*(1-.5))/(.5-.3333);
zd=(EMA(Close,3) * (2 / 4 - 1) - EMA(Close,5) * (2 / 6 - 1)) / (2 / 4 -2 /6);
Cond0=EMA(C,3)>EMA(C,5);
NR7 = (Ref(H,-1) - Ref(L,-1)) < Ref(LLV(H-L,7),-1);
V1=V;
V2=Ref(V,-1);
Title = EncodeColor(colorRed) +  Name() + " - " + EncodeColor(colorBlue)+ Interval(2)  +
 "  - " + Date() +" - " +EncodeColor(colorBlue) +"Open-"+O+"  "+"High-"+H+"  "+"Low-"+L+"  "+
"Close-"+C+"  "+ "Vol= "+ WriteVal(V,1.0)+"    "+"Lot Size "+WriteVal(RoundLotSize,1.0)+"  Margin   "+WriteVal(MarginDeposit,1.0)+
"\n"+ " Todays Vol = "+WriteVal(V1,1.0)+" Ydays Vol = "+WriteVal(V2,1.0)+"\n"+
 "3ema= "+ WriteVal(EMA(C,3),1.2)+"    "+ "5ema= "+ WriteVal(EMA(C,5),1.2)+"\n"+
 "5 period reversal=  "+ WriteVal(tsl,1.2)+"\n"+
EncodeColor(colorLime)+
WriteIf (Buy , " GO LONG / Reverse Signal at "+e+"  ","")+
WriteIf (Sell , " EXIT LONG / Reverse Signal at "+e+"  ","")+"\n"+EncodeColor(colorRed)+
WriteIf(Sell , "Total Profit/Loss for the Last Trade Rs."+(C-BuyPrice)+"","")+
WriteIf(Buy  , "Total Profit/Loss for the Last trade Rs."+(SellPrice-C)+"","")+EncodeColor(colorBlue)+
WriteIf(Long AND NOT Buy, "Trade : Long - Entry price Rs."+(BuyPrice),"")+EncodeColor(colorRed)+
WriteIf(shrt AND NOT Sell, "Trade : Short - Entry price Rs."+(SellPrice),"")+"\n"+EncodeColor(colorBlue)+
WriteIf(Long AND NOT Buy, "Current Profit/Loss Rs."+(C-BuyPrice)+"","")+
WriteIf(shrt AND NOT Sell, "Current Profit/Loss Rs."+(SellPrice-C)+"","")+
"\n"+ " Today's Reversal @ "+WriteVal(e,1.2);
AlertIf( Buy, "SOUND C:\\Windows\\Media\\notify.wav", "Audio alert", 1,2,1 );
AlertIf( Sell, "SOUND C:\\Windows\\Media\\notify.wav", "Audio alert", 2,2,1 );

GfxSelectFont("Tahoma", Status("pxheight")/12 );
GfxSetTextAlign(6.5 );// center alignment
GfxSetTextColor( ColorHSB( 42, 42, 42 ) );
GfxSetBkMode(0); // transparent
GfxTextOut( " " +Close, Status("pxwidth")/2, Status("pxheight")/8 );
GfxSetTextColor( ColorHSB( 42, 42, 42 ) );
TimeFrameSet(inDaily);
V1=V;
V2=Ref(V,-1);
V3=LLV(L,250);
OI1=Ref(OI,-1);
OI2=(OI-OI1)/1000;
L1=LLV(L,250);
L2=L;
H1=H;
Oa=Open;
Ha=High;
La=Low;
Cond11=Oa==Ha;
Cond12=Oa==La;
TimeFrameRestore();

_SECTION_BEGIN("OLH");
GfxSetOverlayMode(0);
GfxSelectFont("Tahoma", Status("pxheight")/15 );
GfxSetTextAlign(6.5 );// center alignment
GfxSetTextColor( ColorHSB( 42, 42, 42 ) );
GfxSetBkMode(0); // transparent
GfxTextOut( WriteIf(Cond11, "  Open=High     "," "), Status("pxwidth")/1.3, Status("pxheight")/1.25 );
GfxTextOut( WriteIf(Cond12, " Open=Low    "," "), Status("pxwidth")/1.3, Status("pxheight")/1.25 );
1 comments
Leave Comment
Please login here to leave a comment.
VERY NICE JOB