Consecutive periods of rise/fall ribbon for Amibroker (AFL)
jasmith almost 13 years ago Amibroker (AFL)
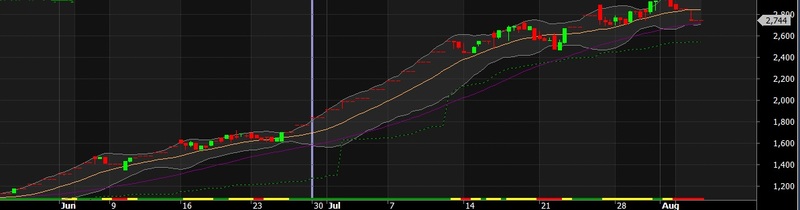
Shows consecutive periods of rise/fall in price (Avg) as green/red/yellow points on a ribbon. Very useful for visualizing trending and ranging stretches. Can be used to write higher order indicators/systems.
Screenshots
Indicator / Formula
Copy & Paste Friendly
function isRising ( array, periods )
{
    result = True;

    for ( i = 0; i < periods; i++ )
    {
        result = result AND ( Ref( array, -i ) >= Ref( array, -( i + 1 ) ) );
        //result = ( result == True ) AND ( PercentageDecrease( Ref( array, -( i + 1 ) ), Ref( array, -i ) ) < DecreaseThreshold );
    }
    return result;
}

function isFalling ( array, periods )
{
    result = True;

    for ( i = 0; i < periods; i++ )
    {
        result = ( result == True ) AND ( Ref( array, -i ) <= Ref( array, -( i + 1 ) ) );
        //result = ( result == True ) AND ( PercentageIncrease( Ref( array, -( i + 1 ) ), Ref( array, -i ) ) < IncreaseThreshold );
    }
    return result;
}


_SECTION_BEGIN("Rise && Fall Ribbon");
Price = ParamField("Price field",4);
Periods = Param("Consecutive periods", 3, 1, 100, 1 );
Ribbon1 = IIf( isRising(Price,Periods)== True , colorGreen, IIf( isFalling(Price,Periods) == True , colorRed, colorYellow ) );
Plot( 5, "Ribbon", Ribbon1, styleOwnScale | styleArea | styleNoLabel, 0, 100 );
_SECTION_END();
0 comments
Leave Comment
Please login here to leave a comment.