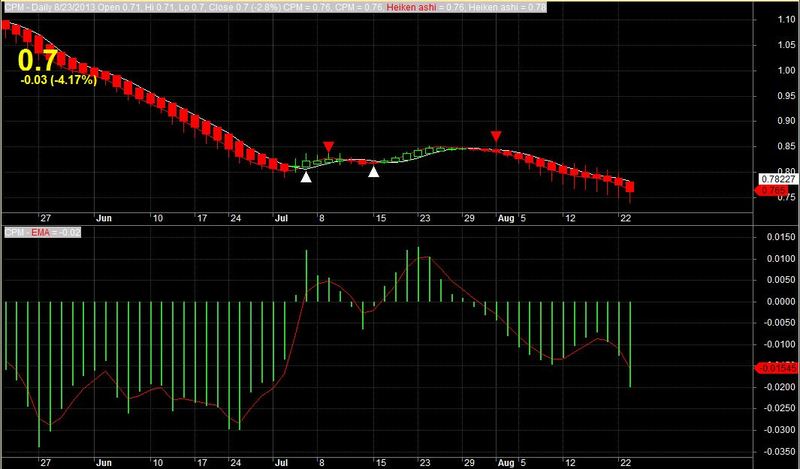
Heiken Ashi Histogram for Amibroker (AFL)
J0n Sn0w almost 13 years ago Amibroker (AFL)
This simple code is for easily visualize the changes of the body of the Heiken Ashi candle.
I also included the Heiken Ashi afl which I use for the coding. The Heiken Ashi and the histogram are 2 separate afl codes.
Screenshots
Indicator / Formula
Copy & Paste Friendly
//Heiken Ashi candlestick formula//

SetChartBkGradientFill( ParamColor("BgTop", colorBlack),ParamColor("BgBottom", colorBlack),ParamColor("Titleblock",colorBlack ));
SetChartOptions(0,chartShowArrows|chartShowDates);
GraphXSpace=5;
p=Param("Period",6,2,30,1);
Om=MA(O,p);
hm=MA(H,p);
lm=MA(L,p);
Cm=MA(C,p);
HACLOSE=(Om+Hm+Lm+Cm)/4;
HaOpen = AMA( Ref( HaClose, -1 ), 0.5 );
HaHigh = Max( Hm, Max( HaClose, HaOpen ) );
HaLow = Min( Lm, Min( HaClose, HaOpen ) );
PlotOHLC( HaOpen, HaHigh, HaLow, HaClose, "" + Name(), colorWhite, styleCandle | styleNoLabel );
_SECTION_END();


_SECTION_BEGIN("Heiken Ashi Smoothed");
SetChartBkGradientFill( ParamColor("BgTop", colorBlack),ParamColor("BgBottom", colorBlack),ParamColor("Titleblock",colorBlack ));
SetChartOptions(0,chartShowArrows|chartShowDates);
GraphXSpace=5;
p=Param("Period",6,2,30,1);
Om=MA(O,p);
hm=MA(H,p);
lm=MA(L,p);
Cm=MA(C,p);
HACLOSE=(Om+Hm+Lm+Cm)/4;
HaOpen = AMA( Ref( HaClose, -1 ), 0.5 );
HaHigh = Max( Hm, Max( HaClose, HaOpen ) );
HaLow = Min( Lm, Min( HaClose, HaOpen ) );
PlotOHLC( HaOpen, HaHigh, HaLow, HaClose, "" + Name(), colorWhite, styleCandle | styleNoLabel );
_SECTION_END();
Line=ParamToggle("Show Line chart also","Hide|Show",0);
if(Line==1) {
Plot(C,"Close",colorWhite,styleLine);
}


a=LinearReg(HaClose, 5 ) ;
b=LinearReg( HaClose, 5 ) ;

Plot( IIf(HaHigh>HaOpen,a,b), _DEFAULT_NAME(), colorRed, ParamStyle("Style") );

Plot( LinearReg( HaOpen, 5 ), _DEFAULT_NAME(), colorWhite, ParamStyle("Style") );

_SECTION_BEGIN("kgs 12 26 ma buy sell");


a=MA(C,3) ;
b=MA(C,15) ;

Buy = Cross( a,b );
Sell = Cross( b,a );
//Short = Sell;
//Cover = Buy;

//AlertIf( Buy, "", "MA cross BUY", 1,1+2 );

//AlertIf( Sell, "", "MA cross SELL", 2 ,1+2);

PlotShapes( shapeUpTriangle*Buy, colorWhite, 0, L, -20 );
PlotShapes( shapeDownTriangle*Sell, colorRed, 0, H, -20 );
_SECTION_END();


_SECTION_BEGIN("Magnified Market Price");
//by Vidyasagar, vkunisetty@yahoo.com//
FS=Param("Font Size",30,30,100,1);
GfxSelectFont("Arial", FS, 900, italic = False, underline = False, True );
GfxSetBkMode( colorWhite );
GfxSetTextColor( ParamColor("Color",colorYellow) );
//Hor=Param("Horizontal Position",800,800,800,800);

Hor=Param("Horizontal Position",20,20,500,20);


Ver=Param("Vertical Position",50,50,250,50);
GfxTextOut(""+C,Hor , Ver );
YC=TimeFrameGetPrice("C",inDaily,-1);
DD=Prec(C-YC,2);
xx=Prec((DD/YC)*100,2);
GfxSelectFont("Arial", 12, 700, italic = False, underline = False, True );
GfxSetBkMode( colorWhite );
GfxSetTextColor(ParamColor("Color",colorYellow) );
GfxTextOut(""+DD+" ("+xx+"%)", Hor+5, Ver+45 );
_SECTION_END();


_SECTION_BEGIN("Price Line");


PriceLevel = ParamField("PriceField", field = 3 );

Daysback = Param("Bars Back",100,10,500,1);
FirstBar = BarCount - DaysBack;
YY = IIf(BarIndex() >= Firstbar,EndValue(PriceLevel),Null);


side = Param("side",1,0,1000,1);

dist = 0;

for( i = 0; i < BarCount; i++ )
{
if(i+side== BarCount) PlotText( "\n " + PriceLevel[ i ], i, YY[ i ]-dist[i], colorLightBlue );
}


_SECTION_END();

_SECTION_BEGIN("Price1");
SetChartOptions(0,chartShowArrows|chartShowDates);
_N(Title = StrFormat("{{NAME}} - {{INTERVAL}} {{DATE}} Open %g, Hi %g, Lo %g, Close %g (%.1f%%) {{VALUES}}", O, H, L, C, SelectedValue( ROC( C, 1 ) ) ));
//Plot( C, "Close", ParamColor("Color", colorBlack ), styleNoTitle | ParamStyle("Style") | GetPriceStyle() );
_SECTION_END();


//HA Histogram//

_SECTION_BEGIN("Heiken Ashi Smoothed");
SetChartBkGradientFill( ParamColor("BgTop", colorBlack),ParamColor("BgBottom", colorBlack),ParamColor("Titleblock",colorBlack ));
SetChartOptions(0,chartShowArrows|chartShowDates);
GraphXSpace=5;
p=Param("Period",6,2,30,1);
Om=MA(O,p);
hm=MA(H,p);
lm=MA(L,p);
Cm=MA(C,p);
HACLOSE=(Om+Hm+Lm+Cm)/4;
HaOpen = AMA( Ref( HaClose, -1 ), 0.5 );
HaHigh = Max( Hm, Max( HaClose, HaOpen ) );
HaLow = Min( Lm, Min( HaClose, HaOpen ) );
_SECTION_END();


Histo1 = HACLOSE-HaOpen;
HistoEMA = EMA (Histo1,3);
Plot( Histo1, "HA Histogram", ParamColor("Histogram color", colorGreen ), styleNoTitle | ParamStyle("Histogram style", styleHistogram | styleNoLabel, maskHistogram ) );
Plot (HistoEMA, "EMA", colorRed, styleLine, 0,0,0,0);
3 comments
Leave Comment
Please login here to leave a comment.
Thanks a lot, one question, does it look into future?
Because Amibroker code check says it does but ref functions are used with -1 parameter which references last bar.
from what i understand on Heiken Ashi it cannot, since the candles are based on the previous one. plus the formula are just bits and piece of other formulas (MACD and Heiken) which i modified. but I’m no expert.
if you could modify it to look into the future, feel free.
great sharing thank you bro////