Support Indicator (Bottom) for Amibroker (AFL)
nowrajhere almost 13 years ago Amibroker (AFL)
Hi,
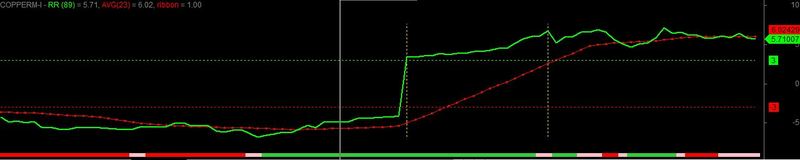
This is only support indicator.
No a full indicator and for the result, I have attached screen shot.
Naveen Raj
Screenshots
Indicator / Formula
Copy & Paste Friendly
n=89; Av=23; stp=9;
n = Param("Periods",n,20,190,1);
av = Param("Average",av,2,30,1);
//n = Optimize("Periods",n,20,190,1);
//av = Optimize("Average",av,2,30,1);
stp = Optimize("Stop",stp,4,15,1);

RR= (C-MA(C,n))/EMA(ATR(1),n);

Plot( RR, "RR (" +WriteVal( n, 1.0 )+")" , 5, 5 );
Plot( 3, "" , 5, styleDashed );
Plot( -3, "" , 4, styleDashed );

RRAVG=MA(RR,av);

Plot(RRAVG,"AVG"+"("+WriteVal(Av, 1.0 )+")" ,colorRed,styleDots,styleDashed);

Buy=Cross(RR,3);
Sell=Cross(0,RR);

////////////////////////////////////////////////////////////////

TD1 = ParamToggle("DAY","Hide|Show",1);
if(TD1==1) {
acc = Param("Acceleration", 0.08, 0, 1, 0.001 );
accm = Param("Max. acceleration", 0.2, 0, 1, 0.001 );

// Vertical Daily Segment
segments = IIf( Interval() < inDaily, Day(), Month() );
segments = segments != Ref( segments , -1 );
Plot( segments, "", colorGold, styleHistogram | styleOwnScale | styleDashed | styleNoLabel );

Volbar = TimeFrameGetPrice( "V", in1Minute * 20, 0 );
_TRACE( "Volbar = " + Volbar );

// Seconds Remaining
}

_SECTION_BEGIN("Ribbon");

Tr2 = Ref(C,1);
Tr3=Ref(C,8);
Trend2 = MA(Tr2,8);
Trend3=MA(Tr3,8);
Slope1=((Trend3-Trend2)/Trend3)*100;
//Plot(Slope1,"Buy When it is Green and Sell when it is Red or Pink",colorGold,styleLine+styleDots|styleThick);


Tr4 = Ref(C,8);
Tr5=Ref(C,13);
Trend3 = MA(Tr4,13);
Trend4=MA(Tr5,13);
Slope2=((Trend4-Trend3)/Trend4)*100;
Buy= nwbull=slope1 > 0 AND slope2 > 0 ;
Sell=nwbear=slope1 < 0 AND slope2 < 0 ;
 Plot( 1, /*efines the height of the ribbon in percent of pane width */"ribbon",
 IIf( nwbull, colorLime, IIf( nwbear, colorRed,IIf(Signal()<MACD(), colorPink, colorPink ))), /* choose color */
 styleOwnScale|styleArea|styleNoLabel, 0, 50 );
_SECTION_END();


SetChartBkColor(ParamColor("Background Color", colorBlack));


GraphXSpace = Param("GraphXSpace",18,-35,20,0.5);
8 comments
Leave Comment
Please login here to leave a comment.
Thanks Navin, Please let us know about How to use this indicator during trading….dp
I am not able to attach alternative screen shot for your query.
Use all in one indicator.afl from Basic charts along with support indicator and check the result.
- Naveen Raj
hi
mr. Naveen
what time frame has to be used for intraday? can u send me both the file for my email ravinikl@yahoo.com
regards
ravi
Qatar
middle east
Hi all,
Minimum Time frame to trade is 30 min (My suggestions and trade). for good result. Don’t not trade less than 30 min. You will get more confusion.
- Raj
Naveen . . .
In the calculation for Slope . . . the Ref indicator is used with positive numbers . . . which is a look ahead value . . . therefore the slope calculation has perfect future vision . . . is that what was intended ? thanks . . rbuck
Naveen . . .
I took the liberty of modifying your code . . . and I like it. In addition to your double slope approach I added my ranking and screen filter. The out-of-sample results for a 3 position portfolio YTD against the IBD Week End Review Stocks was a 73% gain with all 22 trades profitable. Hope you can improve my modifications . . .
. . . by grace, rbuck
Naveen, I could not understand. Could you please be let me know how to use it in the trading (not intraday)? Thanks.
could you please fix scan?it seems wrong!