Visual BackTest for Amibroker (AFL)
sethmo over 12 years ago Amibroker (AFL)
I created this indicator because after spending many hours working on my trading system, I find that Amibroker doesn’t have range bar timeframes in the backtester. So I developed this so I could test my system quickly and easily without using the backtester.
As for the trade condition and trade management, I created those because I had a problem with prior systems overlapping trades. So the systemstate variable prevents overlapping (i.e. having a long and short trade open at the same time) – that’s just for me, use it if you find it useful, otherwise, you can delete the trade conditions and just directly edit Buy, Sell, Short, Cover.
Lastly, there’s a very basic summary of the number of trades and the win ratio.
How to use:
Define your entry rules under LongEntry1 and ShortEntry1. If you have multiple, then create LongEntry2 and ShortEntry2, etc. Then under LongEntry and “or LongEntry2”, etc. Same applies for the exits. If you don’t have any conditions, just enter 0 (zero).
Then under LongEntryPrice and all the other prices, replace O with your price.
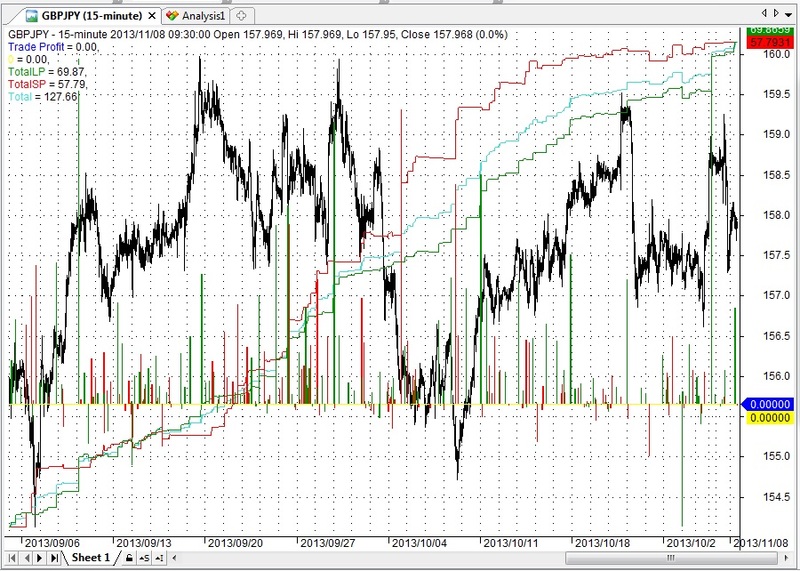
Explanation of the Graphs:
The TradeProfits graphs (the histogram) show the profit/loss made per trade. They are plotted about the 0 line, so anything under the 0 line is a loss. You can see at a glance your win/loss ratio.
The totals graphs show the cumulative profits/losses as and when a trade is closed. This gives you and idea of the effect of the trades on your total points/gained lost. Up is good, down is bad.
Enjoy.
DISCLAIMER: Don’t trade this system! It’s just there as an example. I can’t be held responsible for any results my formula produces. As with anything, take your time to learn how to do something well and right before committing real money.
Screenshots
Indicator / Formula
//Visual BackTest for Amibroker
//Made by Sethmo (Ipeleng Molete)
//Date Made: 8 November 2013
//Feel free to use as you wish, please acknowledge the author

SetBarsRequired(-2,0);
SetChartOptions(0,chartShowArrows|chartShowDates);
_N(Title = StrFormat("{{NAME}} - {{INTERVAL}} {{DATE}} Open %g, Hi %g, Lo %g, Close %g (%.1f%%) {{VALUES}}", O, H, L, C, SelectedValue( ROC( C, 1 ) ) ));

EMA1 = EMA(C, 5);
EMA2 = EMA(C, 10);

WMA1 = WMA(C, 5);
WMA2 = WMA(C, 10);

Color = colorBlack;

//----------------------------------------------------------//
//	TRADE CONDITIONS
//----------------------------------------------------------//

LongEntry1 = Cross(EMA1,EMA2);
ShortEntry1 = Cross(WMA2,WMA1);

LongExit1 = Cross(EMA2,EMA1);
ShortExit1 = Cross(WMA1,WMA2);

LongEntry = LongEntry1;
ShortEntry = ShortEntry1;

LongExit = LongExit1;
ShortExit = ShortExit1;

LongEntryDate = ValueWhen(LongEntry1, DateTime());
ShortEntryDate = ValueWhen(ShortEntry1, DateTime());
LongExitDate = ValueWhen(LongExit1, DateTime());
ShortExitDate = ValueWhen(ShortExit1, DateTime());

Longtrue = Flip(Longentry, LongExit);
Shorttrue = Flip(Shortentry, Shortexit);

systemState = IIf(Shorttrue AND !Longtrue, 0, //in short trade
				IIf(Longtrue AND !Shorttrue, 1, //in long trade
				IIf(!Longtrue AND !Shorttrue, 2, 3)));//ready

LongEntry = LongEntry AND systemstate == 1;
ShortEntry = ShortEntry AND systemstate == 0;

//----------------------------------------------------------//
//	TRADE MANAGEMENT
//----------------------------------------------------------//

Buy = LongEntry AND systemstate == 1;
Sell = LongExit;
Short = ShortEntry AND systemstate == 0;
Cover = ShortExit;

inlong = Flip(Buy, Sell);
inshort = Flip(Short, Cover);

realBuy = inlong AND !Ref(inlong, -1);
realSell = !inlong AND Ref(inlong, -1);
realShort = inshort AND !Ref(inshort,-1);
realCover = !inshort AND Ref(inshort,-1);

LongEntryPrice = ValueWhen(realBuy,O);
LongExitPrice = ValueWhen(realSell,O);
ShortEntryPrice = ValueWhen(realShort,O);
ShortExitPrice = ValueWhen(realCover,O);

BuyPrice = LongEntryPrice;
SellPrice = LongExitPrice;
ShortPrice = ShortEntryPrice;
CoverPrice = ShortExitPrice;

//----------------------------------------------------------//
//	PLOTTING
//----------------------------------------------------------//
LongProfit = IIf(realSell,ValueWhen(realSell,LongExitPrice - LongEntryPrice),0);
ShortProfit = IIf(realCover,ValueWhen(realCover, ShortEntryPrice - ShortExitPrice),0);

Profit = IIf(realSell, LongProfit,
		  IIf(realCover, ShortProfit, 0));

TotalLP = Sum(LongProfit, Cum(1));
TotalSP = Sum(ShortProfit, Cum(1));
Total = TotalLP + TotalSP;

LongProfitColour = colorGreen;
ShortProfitColour = colorRed;
TotalColour = colorTurquoise;

LongTrades = 0;
ShortTrades = 0;
LongWinners = 0;
ShortWinners = 0;

for (i = 0; i < BarCount - 1; i++)
{
	if(realSell[i])
	{
		LongTrades++;
	}
	if(realCover[i])
	{
		ShortTrades++;
	}
	if(LongProfit[i] > 0)
	{
		LongWinners++;
	}
	if(ShortProfit[i] > 0)
	{
		ShortWinners++;
	}
}

LongWinPerc = (LongWinners/LongTrades)*100;
ShortWinPerc = (ShortWinners/ShortTrades)*100;
TotalTrades = LongTrades + ShortTrades;
TotalWinners = LongWinners + ShortWinners;
TotalWinPerc = (TotalWinners/TotalTrades) * 100;

printf("\nLong Trades: \t" + WriteVal(LongTrades, 1.0));
printf("\nShort Trades: \t" + WriteVal(ShortTrades, 1.0));
printf("\nLong Winners: \t" + WriteVal(LongWinners, 1.0));
printf("\nShort Winners: \t" + WriteVal(ShortWinners, 1.0));
printf("\nLong Win %%: \t" + WriteVal(LongWinPerc, 1.0) + "%%");
printf("\nShort Win %%: \t" + WriteVal(ShortWinPerc, 1.0) + "%%");
printf("\nTotal Trades: \t" + WriteVal(TotalTrades, 1.0));
printf("\nTotal Winners: \t" + WriteVal(TotalWinners, 1.0));
printf("\nTotal Win %%: \t" + WriteVal(TotalWinPerc, 1.0) + "%%");

if (ParamToggle("Show TRADE PROFITS?", "No|Yes", 0))
{
	Plot(Profit, "\nTrade Profit", IIf(LongProfit, LongProfitColour, IIf(ShortProfit, ShortProfitColour, colorBlue)), styleThick | styleHistogram | styleLeftAxisScale);
	Plot(0, "\n0", colorYellow, styleThick | styleLeftAxisScale);
}

if (ParamToggle("Show TOTALS?", "No | Yes", 0))
{
	Plot(totalLP, "\nTotalLP", LongProfitColour, styleLine | styleOwnScale);
	Plot(totalSP, "\nTotalSP", ShortProfitColour, styleLine | styleOwnScale);
	Plot(total, "\nTotal", TotalColour, styleThick | styleLine | styleOwnScale);
}

Plot( C, "Close", color, styleNoTitle | styleCandle );

if (ParamToggle("Show REAL TRADES?", "No|Yes", 0))
{
	PlotShapes( realBuy * shapeUpArrow, colorDarkGreen, 0, L, -50);
	PlotShapes( realSell * shapeHollowDownArrow, colorDarkGreen, 0, H, -50);
	PlotShapes( realShort * shapeDownArrow, colorDarkRed, 0, H, -50);
	PlotShapes( realCover * shapeHollowUpArrow, colorDarkRed, 0, L, -50);
}
21 comments
Leave Comment
Please login here to leave a comment.
Excellent, thanks for posting.
Can you tell me why on some charts the short/long/total line doesn’t show but is {EMPTY}. When I perform a normal backtest on the same issue it will give an equity curve.
intresting but very hard to understand
pls make simple to understand
thaks
Hi, Expecto
I’m not sure what your trade signals are, so I can’t say for sure.
Try plotting the trades:
If you don’t see any arrows, then it means your signals aren’t being carried out. Otherwise, you need to check your prices.
That’s my best guess to what’s wrong.
Hi Satish
I recognise I didn’t comment it, but I tried to make it as self-documenting as possible using descriptive variable names. Basically, you tell it when you buy/sell/short/cover and the prices at which you do it at. On the trade exits (sell and cover), it calculates the profit/loss of the trade. After that it adds them all up to give you a mini-report. Apart from that, I’m not sure what it is you want to know.
Thanks for the reply Sethmo.
Here is a screenshot which shows the trades taken. I have solid color = buy/sell, and hollow = short/cover. Total LP shows up but not the other two lines. Hope you can help, because I much prefer this to the normal backtester!
Hmm, that’s a real head scratcher.
Ok, first thing I notice is that trades aren’t happening sequentially, one by one. What I mean is, there isn’t a buy, then sell, then short, then cover. It’s raw trades, like 3 sells in a row, a buy here, some shorts, etc. I created those Trade Conditions to try address that logic (and because, quite frankly, I didn’t trust ExRem), so I home-brewed my own. For this backtester, when you have and exit trade (sell or cover), it takes the exit price you specified and subtracts it from the entry trade (buy or short) price you also specified. From what I’m seeing, it’s probably getting confused what with all those same trades one after the other, so if there are 3 sells in a row, then it’s making 3 subtractions. What I can’t explain is why only the Green line (which is for longs) showing up and the others not, at least, not without code.
I’ve attached a sample of ideally what your trades should be looking like, an entry followed by an exit followed by another entry and a corresponding exit.
As a short-term measure/test, put 0 for your short trades and use exrem on the long trades, see what lines come up, when 0 the long trades and exrem the short ones, see what happens then.
Sorry if this seems like I’m fishing for solutions, but that’s the nature of debugging, especially when it’s remote. I’d really like for you to find some use in my code, so I’ll help where I can.
Hi,
Can u plez upload the above image formula as I am getting constant sell short or cover buy
Dear Expecto Patronum ,
Excellent work..
Thank you for posting
Hi Sethmo,
[edited]
Thanks, that seemed to help a bit. If I want to view the long trades and totalLP line, I have short/cover = 0; and vice versa for if I want to view the totalSP – is that correct? But I can’t view them both together (well, sometimes it works). The exrem doesn’t seem to make a difference to the output. Strangely, there are still a few occasional stocks which won’t show up any lines.
I am using as an example a stochastic cross.
Regards.
Please check out before real trading, play bar replay in ur amibroker. Buy signal cum on open candle pries but pries go down below open pries
-signal lost and same as sell, short , cover. if u will condition change buy , short , cover , sell at close candle u will in loss.That will cause problems, Amibroker doesn’t know whether it’s a long or short entry.
Here’s my revision:
If you don’t want the trades overlapping (i.e. buy and cover and short and sell signals on the same bar, under the buy, sell, short, cover, you can add:
It’s a crowbar fix, as I call it. But it’ll still give you a rough idea of the system’s performance.
Effectively, it’s Stop and Reverse System. I’m not big into those, but I think there’s an article on the knowledge base about designing such a system.
Good luck.
AmiBroker backtester does have range bars setting! You need to activate tick in File>Database settings>Base time interval!! Range bars are time independent!!! Jesus, think or read before stating nonsense as facts.
Quote: “range bar timeframes” lol I hope you are aware what’s range bars now?
PS: Not to mention it is useful to additionally use tick data but not time based data.
Another milestone info to you.
You can add any custom chart based code to the Reports folder of Charts formula section and it will be displayed in the charts section of the backtest report.
Whoaa! Unbelievable what new amazing perspectives are showing up if reading a help file, aren’t they.
Oh my God, all those newbie blah blah. “This can’t be done… and that can’t be done…” It is not AmiBroker being confused but it’s you being confused about yourself. Funny stuff. All those “facts”.
Look, I’m willing to admit I was wrong, which I was. However I don’t appreciate how you came at me and made assumptions about me. I’m not slandering Amibroker and I didn’t ever state anything as fact. So, if it makes you feel good to run your mouth at strangers over the internet, go ahead an knock yourself out, just do it somewhere else. We’re all a supportive community trying to help each other here. If you don’t have anything nice to say, don’t say anything at all.
JaNa is banned. Go post somewhere else.
very nice work sethmo
Dear,
How are you?In my AmiBroker, data down loader has been installed with DSE General
Index but now DSEX Index is introduced instead of DSE General Index.From then I can not download data with General Index.Do you have any downloader which have the option
to download data with newly introduced DSEX Index.
Regards,
SUNNY
email:ahalimchy@yahoo.com
@AbdulHalimSunny your question is in the wrong place you need to ask it in the forum, official Amiboker support or the Amibroker yahoo groups.
Hi Sunny
I’d suggest you speak to the people from whom you got the downloader. I’ve set Metatrader as a data feed to Amibroker. So I can’t help in that regard, only really with the formula that I have posted.
Thanks.
Here’s the latest version:
http://www.wisestocktrader.com/indicators/4062-visual-backtest-v2