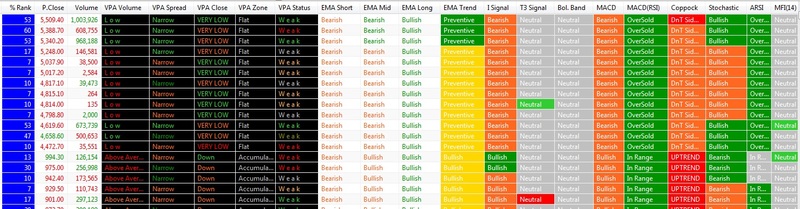
General Market Exploration by XeL fixed by Ali shafiei for Amibroker (AFL) for Amibroker (AFL)
ali32b over 12 years ago Amibroker (AFL)
I fixed this popular afl http://www.wisestocktrader.com/indicators/3118-general-market-exploration-by-xel
Screenshots
Indicator / Formula
Copy & Paste Friendly
/////////////////////////////////////////////////////////
//																//
//			General Market Exploration by XeL	fixed by  //
//						Ali shafiei		  				   //
//						Ver: 1.00.beta						//
//																//
//	Free to Distribute under LGPL 2012	.					//
//	Portions of Code are property of their original		//
//	authors, Cleaning, some new code and Preparation	//
//	are derived by @XeL_Arjona.								//
//	Some Original Code credits:								//
//																//
//	*	Volume Price Analysis by Karthikmarar				//
//			http://vpanalysis.blogspot.mx/					//
//																//
//	*	Jurik Research DMX (Free)							//
//			http://jurikres.com/catalog/ms_dmx.htm		//
//																//
//	*	Extract of some exploration Methodology			//
//		by Manish.												//
//																//
//																//
/////////////////////////////////////////////////////////


/////////////////
//  AFL START  //
/////////////////

//_SECTION_BEGIN("VPA, Momentum & Signal Explorer by XeL");


//////////////////////
// Main Variables   //
//////////////////////
// Count Index value for TrendScore
	i	=	0;
// Display Colors
// Main Color
	Color_buy		=	colorLime				;
	Color_bull		=	colorGreen				;
	Color_bull1	=	colorDarkYellow		;
	Color_bear1	=	colorLightOrange		;
	Color_bear		=	colorOrange			;
	Color_sell		=	colorRed				;
	Color_prev		=	colorGold				;
	Color_acc		=	colorPaleTurquoise	;
	Color_null		=	colorLightGrey		;
//	Background Colors
	BColor_vpa		=	colorBlack				;
	BColor_mas		=	colorDefault			;
	BColor_mam		=	colorDefault			;
	BColor_mal		=	colorDefault			;
//	Alternate Colors
	Color_acc1		=	colorBlueGrey			;

// 52 High Low
High52		=	HHV(High,250);
Low52		=	LLV(Low,250);
// T3 Function
function T3(price,periods)
	{
		s = 0.84;
		e1=EMA(price,periods);
		e2=EMA(e1,Periods);
		e3=EMA(e2,Periods);
		e4=EMA(e3,Periods);
		e5=EMA(e4,Periods);
		e6=EMA(e5,Periods);
		c1=-s*s*s;
		c2=3*s*s+3*s*s*s;
		c3=-6*s*s-3*s-3*s*s*s;
		c4=1+3*s+s*s*s+3*s*s;
		Ti3=c1*e6+c2*e5+c3*e4+c4*e3;
		return ti3;
	}


////////////////////////////////////////////////
// Time to Date % Change and Beta Correlation //
////////////////////////////////////////////////
_SECTION_BEGIN("P/L % Change over Time with Beta Correlation");
// PARAMETERS
	TtD_Param		=	ParamList("Period","Day to Date|Week to Date|Month to Date|Year to Date",0);
	IDX_Param		=	ParamStr("Reference Market Index Symbol","$IME-MEX");
// VARIABLES
	FDayMonth		=	BarsSince(Month() != Ref(Month(),-1));
	FDayYear		=	BarsSince(Year() != Ref(Year(),-1));
	TtD_Period		=	IIf(TtD_Param	==	"Day to Date",1,
						IIf(TtD_Param	==	"Week to Date",DayOfWeek(),
						IIf(TtD_Param	==	"Month to Date",FDayMonth,
						IIf(TtD_Param	==	"Year to Date",FDayYear,0))));
	IDX_Close		=	Foreign(IDX_Param,"Close");
// FORMULA
//		P/L % Change
	TtD_Change		= 100 * (Close - Ref(Close, -TtD_Period) ) / Ref(Close, -TtD_Period);
//		Beta Correlation in Time from Index
	Beta			=	(( TtD_Period * Sum(ROC( C,1) * ROC(IDX_Close,1),TtD_Period )) -
						(Sum(ROC(C,1),TtD_Period) *
						Sum(ROC( IDX_Close,1),TtD_Period))) /
						((TtD_Period * Sum((ROC(IDX_Close,1)^2 ),TtD_Period)) -
						(Sum(ROC(IDX_Close,1 ),TtD_Period)^2 ));
_SECTION_END();


///////////////////////////
// Volume Price Analysis //
///////////////////////////
_SECTION_BEGIN("Volume Price Analysis");
// FORMULA
	SetChartOptions(0,chartShowArrows|chartShowDates);
	DTL=Param("Linear regression period",60,10,100,10);
	wbf=Param("WRB factor",1.5,1.3,2.5,.1);
	nbf=Param("NRB factor",0.7,0.3,0.9,0.1);
	TL=LinRegSlope(MA(C, DTL),2);
	Vlp=Param("Volume lookback period",30,20,300,10);
	Vrg=MA(V,Vlp);
	St = StDev(Vrg,Vlp);
	Vp3 = Vrg + 3*st;
	Vp2 = Vrg + 2*st;;
	Vp1 = Vrg + 1*st;;
	Vn1 = Vrg -1*st;
	Vn2 = Vrg -2*st;
	rg=(H-L);
	arg=Wilders(rg,30);
	wrb=rg>(wbf*arg);
	nrb=rg<(nbf*arg);
	Vl=V<Ref(V,-1) AND V<Ref(V,-2);
	upbar=C>Ref(C,-1);
	dnbar=C<Ref(C,-1);
	Vh=V>Ref(V,-1) AND Ref(V,-1)>Ref(V,-2);
	Cloc=C-L;
	x=rg/Cloc;
	x1=IIf(Cloc=0,arg,x);
	Vb=V>Vrg OR V>Ref(V,-1);
	ucls=x1<2;
	dcls=x1>2;
	mcls=x1<2.2 AND x1>1.8 ;
	Vlcls=x1>4;
	Vhcls=x1<1.35;
	j=MA(C,5);
	TLL=LinRegSlope(j,40) ;
	Tlm=LinRegSlope(j,15) ;
	tls=LinRegSlope(j,5);
	mp=(H+L)/2;
// VOLUME VARIABLES
//		TrendScore Count
	IIf( V>Vp2, i+3,i);
	IIf( V>Vp1, i+2,i);
	IIf( V>VRG, i+1,i);
//		Indicators
	VPAv_Status	=	WriteIf( V>Vp2,	"VERY HIGH",
						WriteIf( V>Vp1,	"High",
						WriteIf( V>Vrg,	"Above Average",
						WriteIf( V<Vrg AND V>Vn1, "Less than Average",
						WriteIf( V<Vn1, "L o w", "" )))));
	VPAv_Color	=		IIf( V>Vp2, Color_buy,
						IIf( V>Vp1, Color_bull,
						IIf( V>Vrg, Color_bull1,
						IIf( V<Vrg AND V>Vn1, Color_bear,
						IIf( V<Vn1, Color_sell, Color_null )))));

// SPREAD VARIABLES
//		Indicators
	IIf( rg>(arg*2), i+2,i);
	IIf( rg>arg, i+1,i);
	VPAs_Status	=	WriteIf( rg>(arg*2), "Wide",
						WriteIf( rg>arg, "Above Average","Narrow"));
	VPAs_Color		=	IIf( rg>(arg*2), Color_buy,
						IIf( rg>arg, Color_bull,Color_bear));

// CLOSE VARIABLES
//		TrendScroe Count
	IIf( Vhcls, i+2,i);
	IIf( ucls, i+1,1);
//		Indicators
	VPAc_Status	=	WriteIf( Vhcls, "VERY HIGH",
						WriteIf( ucls, "High",
						WriteIf( mcls, "Mid",
						WriteIf( dcls, "Down","VERY LOW"))));
	VPAc_Color		=	IIf( Vhcls, Color_buy,
						IIf( ucls, Color_bull,
						IIf( mcls, Color_bull1,
						IIf( dcls, Color_bear,Color_sell))));

// VOLUME ZONE
// FORMULA
	C1 = Ref(C, -1);
	uc = C > C1; dc = C <= C1;
	ud = C > O; dd = C <= O;
	green = 1; blue = 2; yellow = 3; red = 4; white = 5;
	VType = IIf(ud,
	         IIf(uc, green, yellow),
	       IIf(dd,
	         IIf(dc, red, blue), white));
	/* green volume: up-day and up-close*/
	gv = IIf(VType == green, V, 0);
	/* yellow volume: up-day but down-close */
	yv = IIf(VType == yellow, V, 0);
	/* red volume: down-day and down-close */
	rv = IIf(VType == red, V, 0);
	/* blue volume: down-day but up-close */
	bv = IIf(VType == blue, V, 0);
	uv = gv + bv; uv1 = Ref(uv, -1); /* up volume */
	dv = rv + yv; dv1 = Ref(dv, -1); /* down volume */
	VolPer = Param("Adjust Vol. MA per.", 34, 1, 255, 1);//12
	ConvPer = Param("Adjust Conv. MA per.", 9, 1, 255, 1);//6
	MAuv = TEMA(uv, VolPer ); mauv1 = Ref(mauv, -1);
	MAdv = TEMA(dv, VolPer ); madv1 = Ref(madv, -1);
	MAtv = TEMA(V, VolPer );//total volume
	Converge = (TEMA(MAuv - MAdv, ConvPer));
	Converge1 = Ref(Converge, -1);
	ConvergeUp = Converge > Converge1;
	ConvergeOver = Converge > 0;
	rising = ConvergeUp AND ConvergeOver;
	falling = !ConvergeUp AND ConvergeOver;
// VOLUME ZONE
// VARIABLES
//		TrendScore Count
	IIf( rising, i+1,i);
//		Indicators
	VPAz_Status	=	WriteIf(rising,"Accumulation",
						WriteIf(falling,"Distribution","Flat"));
	VPAz_Color		=	IIf(rising,Color_acc,
						IIf(falling,Color_prev,Color_null));

// VOLUME STATUS
// PARAMETERS
	Pp1=Param("Number Of Days",30,1,200,1);
	Pp2=Param("Volume Of Days",15,1,200,1);
// FORMULA
	numDays = Pp1;
	dwWideSpread = 1.8;
	dwNarrowSpread = 0.8;
	dwSpreadMiddle = 0.5;
	dwHighClose = 0.7;
	dwLowClose = 0.3;
	volNumDays = Pp2;
	dwUltraHighVol = 2;
	dwVeryHighVol = 1.75; // was 1.8
	dwHighVol = 1.75; // was 1.8
	dwmoderateVol = 1.10; // was 1.8
	dwLowVol = 0.75; // was 0.8
	/* Classify each bar... */
	upBar = C > Ref(C,-1);
	downBar = C < Ref(C,-1);
	spread = H-L;
	avgRange = Sum(spread, numDays) / numDays;
	wideRange = spread >= (dwWideSpread * avgRange);
	narrowRange = spread <= (dwNarrowSpread * avgRange);
	testHighClose = L + (spread * dwHighClose);
	testLowClose = L + (spread * dwLowClose);
	testCloseMiddle = L + (spread * dwSpreadMiddle);
	upClose = C > testHighClose;
	downClose = C < testLowClose;
	middleClose = C >= testLowClose AND C <= testHighClose;
	avgVolume = EMA(V, volNumDays);
	highVolume = V > (avgVolume * dwHighVol);
	moderateVol= V > (avgVolume * dwmoderateVol);
	veryHighVolume = V > (avgVolume * dwVeryHighVol);
	ultraHighVolume = V > (avgVolume * dwUltraHighVol);
	LowVolume = V < (avgVolume * dwLowVol);
	/* direction AND Title */
	/* Basic patterns... */
	upThrustBar = downClose AND H > Ref(H,-1) AND (C == L) AND downClose AND (NOT narrowRange);
	noDemandBar = narrowRange AND LowVolume AND upBar AND (NOT upClose);
	//noDemandBar = narrowRange AND LowVolume AND upBar AND (V < Ref(V,-1)) AND (V < Ref(V,-2));
	noSupplyBar = narrowRange AND LowVolume AND downBar AND (V < Ref(V,-1)) AND (V < Ref(V,-2));
	absorption = Ref(downbar, -1) AND Ref(highVolume, -1) AND upBar;
	support = Ref(downBar,-1) AND (NOT Ref(downClose,-1)) AND Ref(highVolume,-1) AND upBar;
	stoppingVolume = Ref(downBar,-1) AND Ref(highVolume,-1) AND C > testCloseMiddle AND (NOT downBar);
	bullishsign=moderateVol+UpThrustBar;//OR moderateVol+upBar;
	//rallyEnd = (Ref(highVolume,-1) AND Ref(upBar,-1) AND wideRange AND downBar) OR
	// (narrowRange AND highVolume AND H > Ref(HHV(H, 250), -1));
	/* Strength AND Weakness */
	weakness = upThrustBar OR noDemandBar OR
	(narrowRange AND (H > Ref(H,-1)) AND highVolume) OR
	(Ref(highVolume,-1) AND Ref(upBar,-1) AND downBar AND (H < Ref(H,-1)));
// VARIABLES
//		TrendScore Count
	IIf( bullishsign, i+3,i);
	IIf( upThrustBar, i+2,i);
	IIf( absorption, i+1,i);
//		Indicators
	VPAst_Status	=	WriteIf(Weakness,"W e a k",
						WriteIf(StoppingVolume,"Stopping Volume",
						WriteIf(noSupplyBar,"No Supply",
						WriteIf(support,"Support",
						WriteIf(noDemandBar,"No Demand",
						WriteIf(absorption,"Absorption",
						WriteIf(upThrustBar,"Up Thrust",
						WriteIf(bullishsign,"-=STRONG=-","Neutral"))))))));
	VPAst_Color	=	IIf(Weakness,Color_sell,
						IIf(StoppingVolume,Color_bear,
						IIf(noSupplyBar,Color_bear1,
						IIf(support,Color_bear,
						IIf(noDemandBar,Color_prev,
						IIf(absorption,Color_bull1,
						IIf(upThrustBar,Color_bull,
						IIf(bullishsign,Color_buy,Color_null))))))));
_SECTION_END();


//////////////////////////
// EMA Terms and Trend  //
//////////////////////////
_SECTION_BEGIN("EMA Short, Mid and Long Terms and Trend");
// PARAMETERS
	EMAs1Pds	=	Param("1st. Short Term Period",9,5,14,1);
	EMAs2Pds	=	Param("2nd. Short Term Period",20,15,45,1);
	EMAmPds	=	Param("Mid Term Period",50,46,90,1);
	EMAlPds	=	Param("Long Term Perdiod",200,100,300,1);
// FORMULA
//	EMA Short term signals
	EMAsBuy	=	Cross(EMA(C,EMAs1Pds), EMA(C,EMAs2Pds));
	EMAsSell	=	Cross(EMA(C,EMAs2Pds),EMA(C,EMAs1Pds));
	EMAsBuy	=	ExRem(EMAsBuy, EMAsSell);
	EMAsSell	=	ExRem(EMAsSell, EMAsBuy);
	EMAsBull	=	EMA(C,EMAs1Pds) > EMA(C,EMAs2Pds);
	EMAsBear	=	EMA(C,EMAs1Pds) < EMA(C,EMAs2Pds);
//	EMA Mid term signals
	EMAmBuy	=	Cross(EMA(C,(EMAs1Pds+EMAs2Pds)/2), EMA(C,EMAmPds));
	EMAmSell	=	Cross(EMA(C,EMAmPds), EMA(C,(EMAs1Pds+EMAs2Pds)/2));
	EMAmBuy	=	ExRem(EMAmBuy, EMAmSell);
	EMAmSell	=	ExRem(EMAmSell, EMAmBuy);
	EMAmBull	=	C > EMA(C,EMAmPds);
	EMAmBear	=	C < EMA(C,EMAmPds);
//	EMA Long term signals
	EMAlBuy	=	Cross(EMA(C,EMAmPds), EMA(C,EMAlPds));
	EMAlSell	=	Cross(EMA(C,EMAlPds), EMA(C,EMAmPds));
	EMAlBuy	=	ExRem(EMAlBuy, EMAlSell);
	EMAlSell	=	ExRem(EMAlSell, EMAlBuy);
	EMAlBull	=	C > EMA(C,EMAlPds);
	EMAlBear	=	C < EMA(C,EMAlPds);
// EMA Positional Price Trend (Long-Term)
	EMA_rc		=	C > EMA (C,EMAmPds) AND C < EMA(C,EMAlPds) AND EMA(C,EMAmPds) < EMA(C,EMAlPds);
	EMA_ac		=	C > EMA (C,EMAmPds) AND C > EMA(C,EMAlPds) AND EMA(C,EMAmPds) < EMA(C,EMAlPds);
	EMA_bl		=	C > EMA (C,EMAmPds) AND C > EMA(C,EMAlPds) AND EMA(C,EMAmPds) > EMA(C,EMAlPds);
	EMA_pr		=	C < EMA (C,EMAmPds) AND C > EMA(C,EMAlPds) AND EMA(C,EMAmPds) > EMA(C,EMAlPds);
	EMA_ds		=	C < EMA (C,EMAmPds) AND C < EMA(C,EMAlPds) AND EMA(C,EMAmPds) > EMA(C,EMAlPds);
	EMA_br		=	C < EMA (C,EMAmPds) AND C < EMA(C,EMAlPds) AND EMA(C,EMAmPds) < EMA(C,EMAlPds);
// VARIABLES
//		TrendScore Count
	IIf(EMAsBuy,i+1,i);
	IIf(EMAmBuy,i+1,i);
	IIf(EMAlBuy,i+1,i);
	IIf(EMA_rc,i+3,i);
	IIf(EMA_ac,i+2,i);
	IIf(EMA_bl,i+1,1);
	EMAs_Status	=	WriteIf(EMAsBuy, "-=BUY=-",
						WriteIf(EMAsSell, "-=SELL=-",
						WriteIf(EMAsBull, "Bullish",
						WriteIf(EMAsBear, "Bearish","Neutral"))));
	EMAs_Color		=	IIf(EMAsBuy, Color_buy,
						IIf(EMAsBull, Color_bull,
						IIf(EMAsBear, Color_bear,
						IIf(EMAsSell, Color_sell,Color_null))));
	EMAm_Status	=	WriteIf(EMAmBuy, "-=BUY=-",
						WriteIf(EMAmSell, "-=SELL=-",
						WriteIf(EMAmBull, "Bullish",
						WriteIf(EMAmBear, "Bearish","Neutral"))));
	EMAm_Color		=	IIf(EMAmBuy, Color_buy,
						IIf(EMAmBull, Color_bull,
						IIf(EMAmBear, Color_bear,
						IIf(EMAmSell, Color_sell,Color_null))));
	EMAl_Status	=	WriteIf(EMAlBuy, "-=BUY=-",
						WriteIf(EMAlSell, "-=SELL=-",
						WriteIf(EMAlBull, "Bullish",
						WriteIf(EMAlBear, "Bearish","Neutral"))));
	EMAl_Color		=	IIf(EMAlBuy, Color_buy,
						IIf(EMAlBull, Color_bull,
						IIf(EMAlBear, Color_bear,
						IIf(EMAlSell, Color_sell,Color_null))));
	EMAp_Status	=	WriteIf(EMA_rc, "RECOVERY",
						WriteIf(EMA_ac, "Accumulation",
						WriteIf(EMA_bl, "Bullish",
						WriteIf(EMA_pr, "Preventive",
						WriteIf(EMA_ds, "Distribution",
						WriteIf(EMA_br, "Bearish","Neutral"))))));
	EMAp_Color		=	IIf(EMA_rc, Color_buy,
						IIf(EMA_ac, Color_acc1,
						IIf(EMA_bl, Color_bull,
						IIf(EMA_pr, Color_prev,
						IIf(EMA_ds, Color_bear1,
						IIf(EMA_br, Color_bear,Color_null))))));
_SECTION_END();


////////////////////////
// Initial Buy signal //
////////////////////////
_SECTION_BEGIN("IBuy Signal");
// FORMULA
	I_buy =  Cross(RSI(14), EMA(RSI(14),9));
	I_sell = Cross(EMA(RSI(14),9), RSI(14));
	I_buy = ExRem(I_buy, I_sell);
	I_sell = ExRem(I_sell, I_buy);
	I_bull = RSI(14) > EMA(RSI(14),9);
	I_bear = RSI(14) < EMA(RSI(14),9);
// VARIABLES
//		TrendScore Count
	IIf(I_buy,i+2,i);
	IIf(I_bull,i+1,i);
//		Indicators
	I_Status	=	WriteIf(I_buy,"-=BUY=-",
					WriteIf(I_bull,"Bullish",
					WriteIf(I_bear,"Bearish",
					WriteIf(I_sell,"-=SELL=-","Neutral"))));
	I_Color	=	IIf(I_buy,Color_buy,
					IIf(I_bull,Color_bull,
					IIf(I_bear,Color_bear,
					IIf(I_sell,Color_sell,Color_null))));
_SECTION_END();


/////////////////////
// Price Smoothing //
/////////////////////
_SECTION_BEGIN("T3 Price Smoothing Signal");
// FORMULA
	T3_buy		=	Cross (T3(C,3), T3(C,5));
	T3_sell	=	Cross (T3(C,5), T3(C,3));
	T3_buy		=	ExRem(T3_buy, T3_sell);
	T3_sell	=	ExRem(T3_sell, T3_buy);
// VARIABLES
//		TrendScore Count
	IIf(T3_buy,i+1,i);
//		Indicators
	T3_Status	=	WriteIf(T3_buy,"-=BUY=-",
					WriteIf(T3_sell,"-=SELL=-","Neutral"));
	T3_Color	=	IIf(T3_buy,Color_buy,
					IIf(T3_sell,Color_sell,Color_null));
_SECTION_END();


////////////////////
// Bollinger Band //
////////////////////
_SECTION_BEGIN("Bollinger Bands");
// FORMULA
	BB1			=	C>BBandTop(C,20,2) AND Ref(C,-1)<Ref(BBandTop(C,20,2),-1);
	BB2			=	C<BBandBot(C,20,2) AND Ref(C,-1)>Ref(BBandBot(C,20,2),-1);
// VARIABLES
//		TrendScore Count
	IIf(BB1,i+1,i);
//		Indicators
	BB_Status	=	WriteIf(BB1,"Above Top",
					WriteIf(BB2,"Below Bottom",
					WriteIf(IsNull(MA(C,20)),"N/A","Neutral")));
	BB_Color	=	IIf(BB1,Color_bull,
					IIf(BB2,Color_bear,Color_null));
_SECTION_END();


//////////
// MACD //
//////////
_SECTION_BEGIN("MACD Signal");
// FORMULA
	MACDBull		=	MACD(12,26)>Signal(12,26,9);
// VARIABLES
//		TrendScore Count
	IIf(MACDBull,i+1,i);
//		Indicators
	MACD_Status		=	WriteIf(MACDBull,"Bullish",
							WriteIf(IsNull(MACD(12,26)),"N/A","Bearish"));
	MACD_Color			=	IIf(MACDBull,Color_bull,
							IIf(IsNull(MACD(12,26)),Color_null,Color_bear));
_SECTION_END();


/////////////////
// RSI of MACD //
/////////////////
_SECTION_BEGIN("RSI of MACD Signal");
// PARAMETERS
	RSItPds=Param("Period",14,7,33,1);
	RSItOb_Parm=Param("OverBought Level",70,-200,200,5);
	RSItOs_Parm=Param("OverSold Level",30,-200,200,5);
// FORMULA
	Var=MACD();
	Up=IIf(Var>Ref(Var,-1),abs(Var-Ref(Var,-1)),0);
	Dn=IIf(Var<Ref(Var,-1),abs(Var-Ref(Var,-1)),0);
	Ut=Wilders(Up,RSItPds);
	Dt=Wilders(Dn,RSItPds);
	RSIt=100*(Ut/(Ut+Dt));
	//RSItBuy	=	RSIt < RSItOs_Parm AND RSIt > Ref(RSIt,-1);
	//RSItOs		=	RSIt < RSItOs_Parm AND RSIt < Ref(RSIt,-1);
	//RSItNu		=	RSIt < RSItOs_Parm AND RSIt > RSItOb_Parm AND RSIt > Ref(RSIt,-1);
	//RSItNd		=	RSIt < RSItOs_Parm AND RSIt > RSItOb_Parm AND RSIt < Ref(RSIt,-1);
	//RSItOb		=	RSIt <	RSItOb_Parm AND RSIt > Ref(RSIt,-1);
	//RSItSell		=	RSIt <	RSItOb_Parm AND RSIt < Ref(RSIt,-1);
	RSItOs			=	RSIt < RSItOs_Parm;
	RSItOb			=	RSIt > RSItOb_Parm;
	// VARIABLES
	//		TrendScore Count
	IIf(RSItOs, i+1,i);
	//		Indicators
	RSIt_Status	=	WriteIf(RSItOs,"OverSold",
						WriteIf(RSItOb,"OverBought","In Range"));
	RSIt_Color	=		IIf(RSItOs,Color_bull,
						IIf(RSItOb,Color_sell,Color_null));
_SECTION_END();


///////////
// Aroon //
///////////
//_SECTION_BEGIN("AROON Signal");
//// PARAMETERS
//	ArPeriod=Param("Period",14,7,33,1);
//// FORMULA
//	LLVBarsSince=LLVBars(L,ArPeriod)+1;
//	HHVBarsSince=HHVBars(H,ArPeriod)+1;
//	AroonDown=100*(ArPeriod-LLVBarsSince)/(ArPeriod-1);
//	AroonUp=100*(ArPeriod-HHVBarsSince)/(ArPeriod-1);
//	AroonOsc=AroonUp-AroonDown;
//	Aroon=AroonOsc>0;
//// VARIABLES
//	IIf(Aroon,i+1,i);
//	AROON_Status	=	WriteIf(Aroon,"Bullish",
//						WriteIf(IsNull (RSI(14)),"N/A","Bearish"));
//	AROON_Color	=	IIf(Aroon,Color_bull,
//						IIf(IsNull(RSI(14) ),Color_null,Color_bear));
//_SECTION_END();


/////////
// WAD //
/////////
//_SECTION_BEGIN("Williams Accumulation-Distribution Signal");
// PARAMETERS
//	WADPds=Param("Period",20,7,33,1);
	// FORMULA
//	TrueRangeHigh=Max( Ref(Close,-1), High );
//	TrueRangeLow=Min( Ref(Close,-1), Low );
//	WAD = Cum(IIf(C > Ref(C,-1),C-TrueRangeLow, IIf(C < Ref(C,-1),C-TrueRangeHigh,0)));
//	wadup = WAD > EMA (WAD,WADPds);
//	waddn = WAD < EMA (WAD,WADPds);
//	wadbl = Cross(WAD, EMA(WAD,WADPds));
//	wadbr = Cross(EMA(WAD,WADPds), WAD);
// VARIABLES
//	WAD_Status	=	WriteIf(wadup, "Bullish Zone",
//					WriteIf(waddn, "Bearish Zone",
//					WriteIf(wadbl, "Bullish Cross",
//					WriteIf(wadbr, "Bearish Cross","Neutral"))));
//	WAD_Color	=	IIf(wadup,Color_bull,
//					IIf(wadbl,Color_bear,
//					IIf(wadbr,Color_bull1,
//					IIf(waddn,Color_bear1,Color_null))));
//_SECTION_END();


/////////////
// Coppock //
/////////////
_SECTION_BEGIN("Coppock Indicator");
// FORMULA
	CKr1=ROC(C,14);
	CKr2=ROC(C,11);
	CK=EMA((CKr1+CKr2),10);
	CK_upt=IIf(ck>0 AND ROC(ck,1)>0,ck,0);
	CK_ups=IIf(ck>0 AND ROC(ck,1)<0,ck,0);
	CK_dws=IIf(ck<0 AND ROC(ck,1)>0,ck,0);
	CK_dwt=IIf(ck<0 AND ROC(ck,1)<0,ck,0);
// VARIABLES
//		TrendScore Count
	IIf(CK_upt,i+2,i);
	IIf(CK_ups,i+1,i);
//		Indicators
	Coppock_Status	=	WriteIf( CK_upt,"UPTREND",
							WriteIf( CK_ups,"UpT Sideways",
							WriteIf( CK_dws,"DnT Sideways",
							WriteIf( CK_dwt,"DownTrend","Flat"))));
	Coppock_Color		=	IIf( CK_upt,Color_buy,
							IIf( CK_ups,Color_bull,
							IIf( CK_dws,Color_bear,
							IIf( CK_dwt,Color_sell,Color_null))));
_SECTION_END();


////////////////
// Stochastic //
////////////////
_SECTION_BEGIN("Stochastic %D %K Signal");
// FORMULA
	StochKBull		=	StochK(14,3)>StochD(14,3,3);
// VARIABLES
//		TrendScore Count
	IIf(StochKBull,i+1,i);
//		Indicators
	STOCH_Status	=	WriteIf( StochKBull,"Bullish",
						WriteIf( IsNull(StochK(14,3)),"N/A","Bearish"));
	STOCH_Color	=	IIf(StochKBull,Color_bull,
						IIf( IsNull(StochK(14,3)),Color_null,Color_bear));
_SECTION_END();


//////////
// ARSI //
//////////
_SECTION_BEGIN("ARSI Signal");
// PARAMETERS
	ARSI_Pds		=	Param("Period",14,7,33,1);
	ARSIOb_Parm	=	Param("OverBought Level",70,-200,200,5);
	ARSIOs_Parm	=	Param("OverSold Level",30,-200,200,5);
// FORMULA
	Chg 			=	C - Ref( C, -1 );
	UpCount		=	Sum( Chg >= 0, ARSI_Pds );
	DnCount		=	ARSI_Pds - UpCount;
	UpMove			=	AMA( Max( Chg, 0 ), Nz(1/UpCount) );
	DnMove			=	AMA( Max( -Chg, 0 ), Nz(1/DnCount) );
	RS				=	UpMove/DnMove;
	ARSI			=	100-(100/(1+RS));
	ARSIOs			=	ARSI < ARSIOs_Parm;
	ARSIOb			=	ARSI > ARSIOb_Parm;
	//ARSIUt		=	ARSI > Ref(ARSI,-1);
	//ARSIDt		=	ARSI < Ref(ARSI,-1);
	//ARSIBuy		=	ARSI < ARSIOs AND ARSIUt;
	//ARSISell		=	ARSI >	ARSIOb AND ARSIDt;
	//ARSIBuy		=	ExRem(ARSIBuy, ARSISell);
	//ARSISell		=	ExRem(ARSISell,ARSIBuy);
// VARIABLES
//		TrendScroe Count
	IIf(ARSIOs,i+1,i);
//		Indicators
	ARSI_Status		=	WriteIf(ARSIOs,"OverSold",
							WriteIf(ARSIOb,"OverBought","In Range"));
							//WriteIf(ARSIBuy,"-=BUY=-",
							//WriteIf(ARSI>ARSIOs,"OverSold",
							//WriteIf(ARSIUt,"Improving",
							//WriteIf(ARSIDt,"Declining",
							//WriteIf(ARSI<ARSIOb,"OverBought",
							//WriteIf(ARSISell,"-=SELL=-",""))))));
	ARSI_Color		=		IIf(ARSIOs,Color_bull,
							IIf(ARSIOb,Color_sell,Color_null));
							//IIf(ARSIBuy,Color_buy,
							//IIf(ARSI>ARSIOs,Color_bull,
							//IIf(ARSIUt,Color_bull1,
							//IIf(ARSIDt,Color_bear1,
							//IIf(ARSI<ARSIOb,Color_bear,
							//IIf(ARSISell,Color_sell,Color_null))))));
_SECTION_END();


/////////
// RSI //
/////////
//_SECTION_BEGIN("RSI Signal");
// PARAMETERS
//	RSIPds=Param("Period",14,7,33,1);
//	RSIOb=Param("OverBought Level",70,-200,200,5);
//	RSIOs=Param("OverSold Level",30,-200,200,5);
// FORMULA
//	R1=RSI(RSIPds)>RSIOs AND Ref(RSI(RSIPds),-1)<RSIOs AND Ref(RSI(RSIPds),-2)<RSIOs;
//	R2=RSI(RSIPds)<RSIOb AND Ref(RSI(RSIPds),-1)>RSIOb AND Ref(RSI(RSIPds),-2)>RSIOb;
// VARIABLES
//	IIf(R1,i+1,i);
//	RSI_Status		=	WriteIf(R1,"Improving",
//						WriteIf(R2,"Declining",
//						WriteIf(IsNull(RSI(14)),"N/A","Neutral")));
//	RSI_Color		=	IIf(R1,Color_bull1,
//						IIf(R2,Color_bear1,Color_null));
//_SECTION_END();


/////////
// MFI //
/////////
_SECTION_BEGIN("MFI Signal");
// PARAMETERS
	MFIPds=Param("Period",14,7,33,1);
	MFIOb=Param("OverBought Level",80,-200,200,5);
	MFIOs=Param("OverSold Level",20,-200,200,5);
// FORMULA
	M1=MFI(MFIPds)>MFIOb;
	M2=MFI(MFIPds)<MFIOs;
//	VARIABLES
//		TrendScroe Count
	IIf(M2,i+1,i);
//		Indicators
	MFI_Status		=	WriteIf(M1,"OverBought",
						WriteIf(M2,"OverSold",
						WriteIf(IsNull(MFI(MFIPds)),"Null","Neutral")));
	MFI_Color		=	IIf(M1,Color_sell,
						IIf(M2,Color_buy,Color_null));
_SECTION_END();


/////////////////////////////////
// ADX Trend Strenght with ADX //
/////////////////////////////////
_SECTION_BEGIN("ADX Signal");
// JSB Lib Version
// INITIALIZATION
	SetBarsRequired(100000, 100000);
//	JSB_InitLib();
// PARAMETERS
	ADX_Parm	=	Param( "ADX Period", 8, 5, 50,1);
	ADX_Parma	=	Param( "ADX Perioda", 15, 5, 50,1);
	ADX_Parmb	=	Param( "ADX Periodb", 25, 5, 50,1);
	ADX_Parmc	=	Param( "ADX Periodc", 35, 5, 50,1);
	ADX_Parmd	=	Param( "ADX Periodd", 50, 5, 50,1);
// FORMULA
//	ADX Buy, Sell & Choppy Signal
	ADX_up		=	MA(C,ADX_Parm) > 0;
	ADX_dn		=	MA(C,ADX_Parm) < 0;
	ADX_ch		=	MA(C,ADX_Parma) < MA(C,ADX_Parmb) AND MA(C,ADX_Parmc) < MA(C,ADX_Parmd);
	ADX_Buy	=	Cross(MA(C,ADX_Parm), MA(C,ADX_Parmb));
	ADX_Sell	=	Cross(MA(C,ADX_Parmb), MA(C,ADX_Parm));
	ADX_Buy	=	ExRem(ADX_Buy, ADX_Sell);
	ADX_Sell	=	ExRem(ADX_Sell, ADX_Buy);
	ADX_bull	=	MA(C,ADX_Parm) > MA(C,ADX_Parmb);
	ADX_bear	=	MA(C,ADX_Parm)> MA(C,ADX_Parma);
// ADX Trend Confirmation Signal
	ADXwk		=	ADX(ADX_Parm) < 25;
	ADXst		=	ADX(ADX_Parm) > 25 AND ADX(ADX_Parm) < 50;
	ADXvs		=	ADX(ADX_Parm) > 50 AND ADX(ADX_Parm) < 75;
	ADXex		=	ADX(ADX_Parm) > 75 AND ADX(ADX_Parm) < 100;
	ADXchoppy	=	ADX(ADX_Parm) < PDI(ADX_Parm) AND ADX(ADX_Parm) < MDI(ADX_Parm);
// VARIABLES
//		TrendScore Count
	IIf(ADX_Buy,i+2,i);
	IIf(ADX_bull,i+1,i);
//	IIf(ADXst,i+1,i);
//		Indicators
	ADX_Status		=	WriteIf(ADX_Buy,"-=BUY=-",
						WriteIf(ADX_bull,"Bullish",
						WriteIf(ADX_bear,"Bearish",
						WriteIf(ADX_Sell,"-=SELL=-","Neutral"))));
	ADX_Color		=	IIf(ADX_Buy,Color_buy,
						IIf(ADX_bull,Color_bull,
						IIf(ADX_bear,Color_bear,
						IIf(ADX_Sell,Color_sell,Color_null))));
	//ADXc_Status	=	WriteIf(ADXwk,"Weak",
	//					WriteIf(ADXst,"Good",
	//					WriteIf(ADXvs,"Strong",
	//					WriteIf(ADXex,"EXCELENT",
	//					WriteIf(ADXchoppy,"Choppy","Neutral")))));
	//ADXc_Color		=	IIf(ADXwk,Color_sell,
	//					IIf(ADXst,Color_bull1,
	//					IIf(ADXvs,Color_bull,
	//					IIf(ADXex,Color_buy,
	//					IIf(ADXchoppy,Color_prev,Color_null)))));
_SECTION_END();


///////////////////////
// Trend Score Count //
///////////////////////
_SECTION_BEGIN("Trend Score Count");
	TrendScore		=	IIf(V>Vp2,3,0) +
						IIf(V>Vp1,2,0) +
						IIf(V>VRG,1,0) +
						IIf(rg>(arg*2),2,0) +
						IIf(rg>arg,1,0) +
						IIf(rising,1,0) +
						IIf(bullishsign,3,0) +
						IIf(upThrustBar,2,0) +
						IIf(absorption,1,0) +
						IIf(EMAsBuy,1,0) +
						IIf(EMAmBuy,1,0) +
						IIf(EMAlBuy,1,0) +
						IIf(EMA_rc,3,0) +
						IIf(EMA_ac,2,0) +
						IIf(EMA_bl,1,0) +
						IIf(I_buy,2,0) +
						IIf(I_bull,1,0) +
						IIf(T3_buy,1,0) +
						IIf(BB1,1,0) +
						IIf(MACDBull,1,0) +
						//IIf(Aroon,1,0) +
						IIf(CK_upt,2,0) +
						IIf(CK_ups,1,0) +
						IIf(StochKBull,1,0) +
						IIf(RSItOs,1,0) +
						IIf(ARSIOs,1,0) +
						//IIf(R1,1,0) +
						IIf(M2,1,0) +
						IIf(ADX_Buy,2,0);
						IIf(ADX_bull,1,0);
						//IIf(ADXst,1,0);
	ScoreRank		=	100 * TrendScore / 30;
_SECTION_END();

//////////////////////
// Exploration Code //
//////////////////////
_SECTION_BEGIN("Explorer");
// PARAMETERS
	EXPfil_Parm	=	ParamList	( "Filter","All Symbols|Buy Signals|Sell Signals",0);
	EXPvol_Parm	=	Param		( "20 Day Min. Vol. Cap.", 50000,0,100000000,1000);
	EXPvol_Parm	=	Param		( "Min. Price Close",15,0,5000000,1);
// FILTER
Filter = 1;
// DISPLAY COLUMNS
	//AddColumn	(High52,"52 Week High");
	//AddColumn	(Low52,"52 Week Low");
	AddColumn		(C,"P.Close",1.2,IIf(C>Ref(C,-1),		colorGreen,colorRed));
	AddColumn		(V,"Volume",1,IIf(V>Ref(V,-1),			colorGreen,colorRed));
	AddTextColumn	(VPAv_Status,"VPA Volume",1,			VPAv_Color,BColor_vpa);
	AddTextColumn	(VPAs_Status,"VPA Spread",1,			VPAs_Color,BColor_vpa);
	AddTextColumn	(VPAc_Status,"VPA Close",1,				VPAc_Color,BColor_vpa);
	AddTextColumn	(VPAz_Status,"VPA Zone",1,				VPAz_Color,BColor_vpa);
	AddTextColumn	(VPAst_Status,"VPA Status",1,			VPAst_Color,BColor_vpa);
	AddTextColumn	(EMAs_Status,"EMA Short",1,				EMAs_Color,BColor_mas);
	AddTextColumn	(EMAm_Status,"EMA Mid",1,				EMAm_Color,BColor_mam);
	AddTextColumn	(EMAl_Status,"EMA Long",1,				EMAl_Color,BColor_mal);
	AddTextColumn	(EMAp_Status,"EMA Trend",1,				colorWhite,EMAp_Color);
	AddTextColumn (I_Status,"I Signal",1,					colorWhite,I_Color);
	AddTextColumn (T3_Status,"T3 Signal",1,				colorWhite,T3_Color);
	AddTextColumn	(BB_Status,"Bol. Band",1,				colorWhite,BB_Color);
	AddTextColumn	(MACD_Status,"MACD",1,					colorWhite,MACD_Color);
	AddTextColumn	(RSIt_Status,"MACD(RSI)",1,				colorWhite,RSIt_Color);
	//AddTextColumn	(AROON_Status,"Aroon",1,			colorWhite,AROON_Color);
	//AddTextColumn	(WAD_Status,"Williams A/D",1,		colorWhite,WAD_Color);
	AddTextColumn (COPPOCK_Status,"Coppock",1,			colorWhite,COPPOCK_Color);
	AddTextColumn	(STOCH_Status,"Stochastic",1,			colorWhite,STOCH_Color);
	AddTextColumn	(ARSI_Status,"ARSI",1,					colorWhite,ARSI_Color);
	//AddTextColumn	(RSI_Status,"RSI",1,					colorWhite,RSI_Color);
	AddTextColumn	(MFI_Status,"MFI(14)",1,				colorWhite,MFI_Color);
	AddTextColumn	(ADX_Status,"DMX (ADX)",1,				colorWhite,ADX_Color);
	//AddTextColumn	(ADXc_Status,"ADX Confirm",1,		colorWhite,ADXc_Color);
	//AddColumn		(RSIt,"TEST L",1,						colorWhite,colorBlack);
	AddColumn		(TtD_Change,"P/L %",1.2,IIf(TtD_Change>0,	colorGreen,colorRed));
	AddColumn		(Beta,"( ? )",1.2,IIf(Beta>0,colorGreen,colorRed));
	AddColumn		(ScoreRank,"% Rank",1.0,colorWhite,colorBlue);
_SECTION_END();
16 comments
Leave Comment
Please login here to leave a comment.
Thanks a ton , bro .
error in line 134
in line 134
x1=IIf(Cloc=0,arg,x);
add another = to solve the problem it should be like this
x1=IIf(Cloc==0,arg,x);
sorry,this is because of copy paste.
I uploaded the afl here:
please give this 5star.
https://drive.google.com/file/d/0B91NKcldbOq8WUV3ck5obWVQakk/edit?usp=sharing
thank you Ali jan, for your contribution on this subject, I hope there be some other Irasnian to help this group to grow more and benefit all of us- 5 star for you
hi to iranian experts
سلام
با این متن چیکار باید بکنم؟
من اون رو در یه فایل متنی با پسوند
afl
کپی کردم … و سپس به روی یه نمودار
ami broker
کشوندم….هیچ چیز نشون نداد و فقط دیدم در قسمت حذف اندیکاتور چندین اندیکارتور که در متن نام برده شده ذکر شده؟
تشکر
======= translated to english ====
hi … what should i do with the above text ???
i saved it to a afl file and drag it to ami broker
but nothing may be showed
and just some indicator is added to the “delete indicators menu”
tnx
Hi downpal.
this is an exploration formula so you should right click on afl then,analysis.in analysis window choose explore.after that result will appear.if you have any question feel free to ask.
Hi,
This AFL in which version it will work. I using Ami 5.50 version.But it is not working. It show blank screen.
Pls. guide me to work.
Thanks,
Adhi
hi dear ali
first, i confused of your hint but after some trial i found that i should copy the afl file to custome folder and then i used it to exploration!
thanks alot
i saw regression indicator codes in this site and copied and save it to a afl file on my desktop.
and again i drag it to amibroker chart, but nothing have been shown…what should i do ?
tnx again
as I mentioned earlier this is not chart but exploration.you should use afl version that I gave you google drive link.
nice thanks master!!!!
dear ali
what sholud i do with
regression indicator………..??
happy new persian year !
Best of the Best scan
How to Interpret the data somebody plz tell us ?? BTW nice afl