Fibonacci Ratracements by Gordon Rose for Amibroker (AFL)
kaiji over 16 years ago Amibroker (AFL)
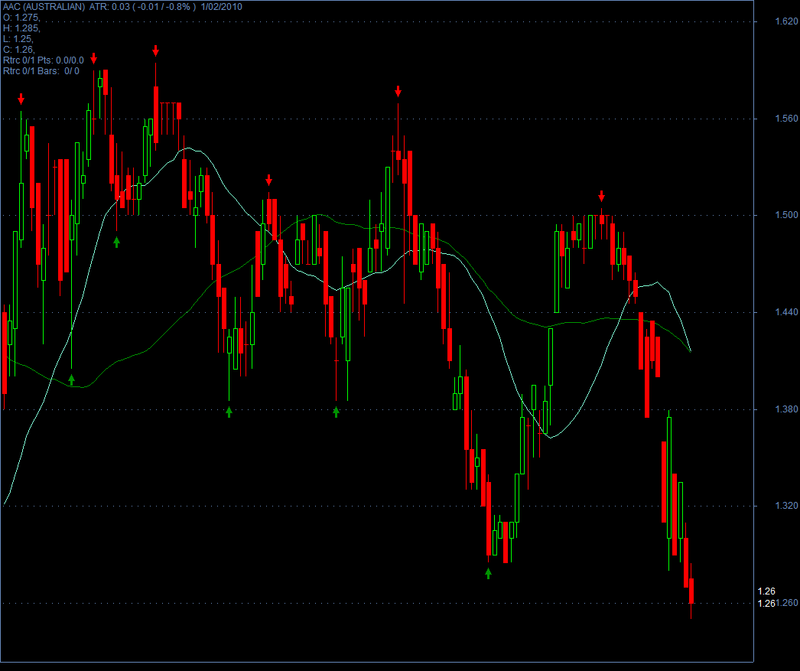
Both indicator and exploration code for combination of fibonacci retracements identified in “Fibonacci for the Active Trader” by Derrik Hobbes. Determines pivots, draws retracements, and explores for them.
Screenshots
Indicator / Formula
Copy & Paste Friendly
// **************************
// BEING EXPLORATION CODE
// **************************

// -- what will be our lookback range for the hh and ll?
nBars = Param("Number of bars", 12, 5, 40);
bTrace = Param("Include trace output", 1, 0, 1);
nNoPivsInSetup = Param("No. Pivs in Setup", 4, 3, 4, 1);
bShowTCZ = Param("Show TCZ", 1, 0, 1);
nMinBarsBtwPivs = Param("Min. number of bars btw. pivots", 1, 1, 10, 1);
nMinPctBtwPivs = Param("Min. percent diff. btw. pivots", .05, .04, .2, .01);
bLastBarCanBePiv = Param("Last bar can be a pivot", 1, 0, 1);
retrcTolerance = .01;
tczTolerance = .005;
nNumBarsToScan = 120;

// -- added from exploration version 20040204
nExploreBarIdx = 0;
nExploreDate = 0;
nCurDateNum = 0;
DN = DateNum();
DT = DateTime();

// -- key exploration variables
bTCZLong = False;
bTCZShort = False;
nAnchorPivIdx = 0;

ADX8 = ADX(8);

// 1 - INDICATOR, 2 - COMMENTARY, 3 - SCAN,
// 4 - EXPLORATION, 5 - BACKTEST / Optimize
if(Status("action")==1) {
	bDraw = True;
	bUseLastVis = Param("Use last visible bar", 1, 0, 1);
} else {
	bDraw = False;
	bUseLastVis = False;
	bTrace = False;
	nExploreDate = Status("rangetodate");
	for (i=LastValue(BarIndex());i>=0;i--) {
		nCurDateNum = DN[i];
		if (nCurDateNum == nExploreDate) {
			nExploreBarIdx = i;
		}
	}
// -- if(Status("action")==1...
}

GraphXSpace=7;

// -- basic candle chart
// -- if this appears inside if block, strange
//    drawing results!
PlotOHLC(Open, High, Low, Close,
	"BIdx = " + BarIndex() +
	"\n" + "O = " + O + "\n"+"H = "+ H + "\n"+"L  = " + L
	+ "\n"+"C ",
	colorBlack, styleCandle);

if (bDraw) {
	Plot(MA(C, 21), "21 bar MA", colorAqua,
		styleLine+styleNoRescale+styleNoLabel);
	Plot(MA(C, 55), "55 bar MA", colorGreen,
		styleLine+styleNoRescale+styleNoLabel);
	//Plot(MA(C, 233), "233 bar MA", colorDarkRed,
	//	styleLine+styleNoRescale+styleNoLabel);
}

// -- Create 0-initialized arrays the size of barcount
aHPivs = H - H;
aLPivs = L - L;
aHPivHighs = H - H;
aLPivLows = L - L;
aHPivIdxs = H - H;
aLPivIdxs = L - L;
aAddedHPivs = H - H;
aAddedLPivs = L - L;
aLegVol = H - H;
aRetrcVol = H - H;

nHPivs = 0;
nLPivs = 0;

lastHPIdx = 0;
lastLPIdx = 0;
lastHPH = 0;
lastLPL = 0;
curPivBarIdx = 0;

// -- looking back from the current bar, how many bars
//    back were the hhv and llv values of the previous
//    n bars, etc.?
aHHVBars = HHVBars(H, nBars);
aLLVBars = LLVBars(L, nBars);
aHHV = HHV(H, nBars);
aLLV = LLV(L, nBars);

// -- Initialize value of curTrend
nLastVisBar = LastValue(
	Highest(IIf(Status("barvisible"), BarIndex(), 0)));

curBar = IIf(nlastVisBar > 0 AND bUseLastVis, nlastVisBar,
	IIf(Status("action")==4 AND nExploreBarIdx > 0, nExploreBarIdx,
	LastValue(BarIndex())));

curTrend = "";
if (aLLVBars[curBar] < aHHVBars[curBar])
	curTrend = "D";
else
	curTrend = "U";

// -- Loop through bars. Search for
//    entirely array-based approach
//    in future version
/* *******************
	Find main pivots
******************* */

// -- Make sure there are enough bars!
if (curBar >= nNumBarsToScan) {
	for (i=0; i<nNumBarsToScan; i++) {

		// -- value of curBar dependent on two parameters
		curBar = IIf(nlastVisBar > 0 AND bUseLastVis,
			nlastVisBar-i,
			IIf(Status("action")==4 AND nExploreBarIdx > 0,
			nExploreBarIdx-i,
			LastValue(BarIndex())-i));

		// -- Have we identified a pivot? If trend is down...
		if (aLLVBars[curBar] < aHHVBars[curBar]) {

			// ... and had been up, this is a trend change
			if (curTrend == "U") {
				curTrend = "D";
				// -- Capture pivot information
				curPivBarIdx = curBar - aLLVBars[curBar];
				aLPivs[curPivBarIdx] = 1;
				aLPivLows[nLPivs] = L[curPivBarIdx];
				aLPivIdxs[nLPivs] = curPivBarIdx;
				nLPivs++;
			}
		// -- or current trend is up
		} else {
			if (curTrend == "D") {
				curTrend = "U";
				curPivBarIdx = curBar - aHHVBars[curBar];
				aHPivs[curPivBarIdx] = 1;
				aHPivHighs[nHPivs] = H[curPivBarIdx];
				aHPivIdxs[nHPivs] = curPivBarIdx;
				nHPivs++;
			}
		// -- 	If curTrend is up...else...
		}

	// -- loop through bars
	}
}
/* *******************
	Found main pivots
******************* */

/* *************************
	Finding missed pivot(s)
************************* */

// -- Start at last bar. Reestablish curBar
curBar =
	IIf(nlastVisBar > 0 AND bUseLastVis,
	nlastVisBar,
	IIf(Status("action")==4 AND nExploreBarIdx > 0,
	nExploreBarIdx,
	LastValue(BarIndex()))
	);

// -- Make sure I found at least two of each above.
if (nHPivs >= 2 AND nLPivs >= 2) {

	lastLPIdx = aLPivIdxs[0];
	lastLPL = aLPivLows[0];

	lastHPIdx = aHPivIdxs[0];
	lastHPH = aHPivHighs[0];

	nLastHOrLPivIdx = Max(lastLPIdx, lastHPIdx);

	nAddPivsRng = curBar - nLastHOrLPivIdx;
	aLLVAfterLastPiv = LLV(L, nAddPivsRng);
	nLLVAfterLastPiv = aLLVAfterLastPiv[curBar];
	aLLVIdxAfterLastPiv = LLVBars(L, nAddPivsRng);
	nLLVIdxAfterLastPiv = curBar - aLLVIdxAfterLastPiv[curBar];
	aHHVAfterLastPiv = HHV(H, nAddPivsRng);
	nHHVAfterLastPiv = aHHVAfterLastPiv[curBar];
	aHHVIdxAfterLastPiv = HHVBars(H, nAddPivsRng);
	nHHVIdxAfterLastPiv = curBar - aHHVIdxAfterLastPiv[curBar];

	// -- Later want to add last high pivot only if
	//    not in buy mode from last and still in trade

	/*
		Note - I'm only interested in adding pivots if I'm in
		a higher-highs or lower-lows scenario
	*/


	// -- OK, let's start where the last high pivot occurs after the
	//    last Low pivot
	if (lastHPIdx > lastLPIdx) {

		/*	There are at least two possibilities here. One is that
	   		the previous high was higher, indicating that this is a
	   		possible short retracement or one in the making.
	   		The other is that the previous high was lower, indicating
	   		that this is a possible long retracement in the working.
			However, both depend on opposing pivots. E.g., if I find
			higher highs, what if I have lower lows?

			If the highs are descending, then I can consider:
	   			- a lower low, and leave it at that
	   			- a higher high and higher low
	   			- a lower low and another lower high
		*/
		if (aHPivHighs[0] < aHPivHighs[1]) {

			if (nLLVAfterLastPiv < aLPivLows[0] AND
				(nLLVIdxAfterLastPiv - lastHPIdx - 1) >= nMinBarsBtwPivs
				AND nLLVIdxAfterLastPiv != curBar	) {

				// -- OK, we'll add this as a pivot.
				//    Mark it for plotting...
				aLPivs[nLLVIdxAfterLastPiv] = 1;
				aAddedLPivs[nLLVIdxAfterLastPiv] = 1;

				//    ...and then rearrange elements in the
				//    pivot information arrays
				for (j=0; j<nLPivs; j++) {
					aLPivLows[nLPivs-j] = aLPivLows[nLPivs-(j+1)];
					aLPivIdxs[nLPivs-j] = aLPivIdxs[nLPivs-(j+1)];
				}
				aLPivLows[0] = nLLVAfterLastPiv;
				aLPivIdxs[0] = nLLVIdxAfterLastPiv;
				nLPivs++;

			// -- Test whether to add piv given last piv is high
			//    AND we have lower highs
			}

		// -- Here, the last piv is a high piv, and we have
		//    higher-highs. The most likely addition is a
		//    Low piv that is a retracement.
		} else {

			if (nLLVAfterLastPiv > aLPivLows[0] AND
				(nLLVIdxAfterLastPiv - lastHPIdx - 1) >= nMinBarsBtwPivs
				AND nLLVIdxAfterLastPiv != curBar	) {

				// -- OK, we'll add this as a pivot.
				//    Mark it for plotting...
				aLPivs[nLLVIdxAfterLastPiv] = 1;
				aAddedLPivs[nLLVIdxAfterLastPiv] = 1;

				//    ...and then rearrange elements in the
				//    pivot information arrays
				for (j=0; j<nLPivs; j++) {
					aLPivLows[nLPivs-j] = aLPivLows[nLPivs-(j+1)];
					aLPivIdxs[nLPivs-j] = aLPivIdxs[nLPivs-(j+1)];
				}
				aLPivLows[0] = nLLVAfterLastPiv;
				aLPivIdxs[0] = nLLVIdxAfterLastPiv;
				nLPivs++;

			// -- Test whether to add piv given last piv is high
			//    AND we have lower highs
			}
		// -- The last piv is a high and we have higher highs
		//    OR lower highs
		}

	/* ****************************************************************
		Still finding missed pivot(s). Here, the last piv is a low piv.
	**************************************************************** */
	} else {

		// -- First case, lower highs
		if (aHPivHighs[0] < aHPivHighs[1]) {

			if (nHHVAfterLastPiv < aHPivHighs[0] AND
				(nHHVIdxAfterLastPiv - lastLPIdx - 1) >= nMinBarsBtwPivs
				AND nHHVIdxAfterLastPiv != curBar	) {

				// -- OK, we'll add this as a pivot.
				//    Mark that for plotting
				aHPivs[nHHVIdxAfterLastPiv] = 1;
				aAddedHPivs[nHHVIdxAfterLastPiv] = 1;

				//    ...and then rearrange elements in the
				//    pivot information arrays
				for (j=0; j<nHPivs; j++) {
					aHPivHighs[nHPivs-j] = aHPivHighs[nHPivs-(j+1)];
					aHPivIdxs[nHPivs-j] = aHPivIdxs[nhPivs-(j+1)];
				}
				aHPivHighs[0] = nHHVAfterLastPiv;
				aHPivIdxs[0] = nHHVIdxAfterLastPiv;
				nHPivs++;

			// -- Test whether to add piv given last piv is high
			//    AND we have lower highs
			}

		// -- Second case when last piv is a low piv, higher highs
		//    Most likely addition is high piv that is a retracement.
		//    Considering adding a high piv as long as it is higher
		} else {

			// -- Where I have higher highs,
			if (nHHVAfterLastPiv > aHPivHighs[0] AND
				(nHHVIdxAfterLastPiv - lastLPIdx - 1) >= nMinBarsBtwPivs
				AND nHHVIdxAfterLastPiv != curBar	) {

				// -- OK, we'll add this as a pivot.
				//    Mark it for plotting...
				aHPivs[nHHVIdxAfterLastPiv] = 1;
				aAddedHPivs[nHHVIdxAfterLastPiv] = 1;

				//    ...and then rearrange elements in the
				//    pivot information arrays
				for (j=0; j<nHPivs; j++) {
					aHPivHighs[nHPivs-j] = aHPivHighs[nHPivs-(j+1)];
					aHPivIdxs[nHPivs-j] = aHPivIdxs[nhPivs-(j+1)];
				}
				aHPivHighs[0] = nHHVAfterLastPiv;
				aHPivIdxs[0] = nHHVIdxAfterLastPiv;
				nHPivs++;

			// -- Test whether to add piv given last piv is high
			//    AND we have lower highs
			}

		}

	}

// -- If there are at least two of each
}

/* ****************************************
// -- Done with finding pivots
***************************************** */

if (bDraw) {

	// -- OK, let's plot the pivots using arrows
	PlotShapes(
		IIf(aHPivs==1, shapeDownArrow, shapeNone),
			colorRed, 0, 	High, Offset=-15);
	PlotShapes(
		IIf(aAddedHPivs==1, shapeDownArrow, shapeNone),
			colorDarkRed, 0, High, Offset=-15);
	PlotShapes(
		IIf(aLPivs==1, shapeUpArrow , shapeNone),
			colorGreen, 0, Low, Offset=-15);
	PlotShapes(
		IIf(aAddedLPivs==1, shapeUpArrow , shapeNone),
			colorDarkGreen, 0, Low, Offset=-15);
}

/* ****************************************
// -- Done with discovering and plotting pivots
***************************************** */

// -- I'm going to want to look for possible retracement
risk = 0;
profInc = 0;
nLeg0Pts = 0;
nLeg0Bars = 0;
nLeg0Vol = 0;
nLeg1Pts = 0;
nLeg1Bars = 0;
nLeg1Vol = 0;
nLegBarsDiff = 0;
nRtrc0Pts = 0;
nRtrc0Bars = 0;
nRtrc0Vol = 0;
nRtrc1Pts = 0;
nRtrc1Bars = 0;
nRtrc1Vol = 0;

minRtrc = 0;
maxRtrc = 0;
minLine = 0;
maxLine = 0;
triggerLine = 0;
firstProfitLine = 0;
triggerInc = 0;
triggerPrc = 0;
firstProfitPrc = 0;
retrcPrc = 0;
retrcBar = 0;
retrcBarIdx = 0;
retrcRng = 0;
aRetrcPrc = H-H;
aRetrcPrcBars = H-H;
aRetrcClose = C;
retrcClose = 0;

// -- Do TCZ calcs. Arrangement of pivs very specific
//    for this setup.
if (nHPivs >= 2 AND
	nLPivs >=2 AND
	aHPivHighs[0] > aHPivHighs[1] AND
	aLPivLows[0] > aLPivLows[1]) {

	tcz500 =
	(aHPivHighs[0] -
	(.5 * (aHPivHighs[0] - aLPivLows[1])));

	tcz618 =
	(aHPivHighs[0] -
	(.618 * (aHPivHighs[0] - aLPivLows[1])));

	tcz786 =
	(aHPivHighs[0] -
	(.786 * (aHPivHighs[0] - aLPivLows[0])));

	retrcRng = curBar  - aHPivIdxs[0];
	aRetrcPrc = LLV(L, retrcRng);
	retrcPrc = aRetrcPrc[curBar];
	aRetrcPrcBars  = LLVBars(L, retrcRng);
	retrcBarIdx = curBar - aRetrcPrcBars[curBar];
	retrcClose = aRetrcClose[retrcBarIdx];

	// -- bTCZLong setup?
	bTCZLong = (

		// -- Are retracement levels arranged in
		//    tcz order?
		tcz500 >= (tcz786 * (1 - tczTolerance))
		AND
		// .681 is below .786 for long setups
		tcz618 <= (tcz786 * (1 + tczTolerance))
		AND

		// -- Is the low in the tcz range
		// -- Is the close >= low of tcz range
		//    and low <= high of tcz range
		retrcClose >= ((1 - retrcTolerance) *  tcz618)
		AND
		retrcPrc <= ((1 + retrcTolerance) *  tcz500)
		);

		// -- risk would be high of signal bar minus low of zone
		//risk = 0;

// -- lower highs and lower lows
} else if (nHPivs >= 2 AND nLPivs >=2
	AND aHPivHighs[0] < aHPivHighs[1]
	AND aLPivLows[0] < aLPivLows[1]) {

	tcz500 =
	(aHPivHighs[1] -
	(.5 * (aHPivHighs[1] - aLPivLows[0])));

	tcz618 =
	(aHPivHighs[0] -
	(.618 * (aHPivHighs[1] - aLPivLows[0])));

	tcz786 =
	(aHPivHighs[0] -
	(.786 * (aHPivHighs[0] - aLPivLows[0])));

	retrcRng = curBar  - aLPivIdxs[0];
	aRetrcPrc = HHV(H, retrcRng);
	retrcPrc = aRetrcPrc[curBar];
	aRetrcPrcBars  = HHVBars(H, retrcRng);
	retrcBarIdx = curBar - aRetrcPrcBars[curBar];
	retrcClose = aRetrcClose[retrcBarIdx];

	bTCZShort = (
		// -- Are retracement levels arranged in
		//    tcz order?

		// .500 is below .786 for short setups
		tcz500 <= (tcz786 * (1 + tczTolerance))
		AND
		// .681 is above .786 for short setups
		tcz618 >= (tcz786 * (1 - tczTolerance))
		AND

		// -- Is the close <= high of tcz range
		//    and high >= low of tcz range
		retrcClose <= ((1 + retrcTolerance) *  tcz618)
		AND
		retrcPrc >= ((1 - retrcTolerance) *  tcz500)
		);

		// -- Risk would be top of zone - low of signal bar
		//risk = 0;
}

Filter = (bTCZShort OR bTCZLong);
AddColumn(C, "Close");
AddColumn(IIf(bTCZLong, 76, 83), "L/S", formatChar);

// **************************
// END EXPLORATION CODE
// **************************

// **************************
// BEGIN INDICATOR CODE
// **************************

// -- what will be our lookback range for the hh and ll?
nBars = Param("Number of bars", 12, 5, 40);
bTrace = Param("Include trace output", 1, 0, 1);
nNoPivsInSetup = Param("No. Pivs in Setup", 4, 3, 4, 1);
bShowTCZ = Param("Show TCZ", 1, 0, 1);
nMinBarsBtwPivs = Param("Min. number of bars btw. pivots", 1, 1, 10, 1);
nMinPctBtwPivs = Param("Min. percent diff. btw. pivots", .05, .04, .2, .01);
bLastBarCanBePiv = Param("Last bar can be a pivot", 1, 0, 1);
retrcTolerance = .01;
tczTolerance = .005;
nNumBarsToScan = 120;

// -- added from exploration version 20040204
nExploreBarIdx = 0;
nExploreDate = 0;
nCurDateNum = 0;
DN = DateNum();
DT = DateTime();

// -- key exploration variables
bTCZLong = False;
bTCZShort = False;
nAnchorPivIdx = 0;

ADX8 = ADX(8);

// 1 - INDICATOR, 2 - COMMENTARY, 3 - SCAN,
// 4 - EXPLORATION, 5 - BACKTEST / Optimize
if(Status("action")==1) {
	bDraw = True;
	bUseLastVis = Param("Use last visible bar", 1, 0, 1);
} else {
	bDraw = False;
	bUseLastVis = False;
	bTrace = False;
	nExploreDate = Status("rangetodate");
	for (i=LastValue(BarIndex());i>=0;i--) {
		nCurDateNum = DN[i];
		if (nCurDateNum == nExploreDate) {
			nExploreBarIdx = i;
		}
	}
// -- if(Status("action")==1...
}

GraphXSpace=7;

// -- basic candle chart
// -- if this appears inside if block, strange
//    drawing results!
PlotOHLC(Open, High, Low, Close,
	"BIdx = " + BarIndex() +
	"\n" + "O = " + O + "\n"+"H = "+ H + "\n"+"L  = " + L
	+ "\n"+"C ",
	colorBlack, styleCandle);

if (bDraw) {
	Plot(MA(C, 21), "21 bar MA", colorAqua,
		styleLine+styleNoRescale+styleNoLabel);
	Plot(MA(C, 55), "55 bar MA", colorGreen,
		styleLine+styleNoRescale+styleNoLabel);
	//Plot(MA(C, 233), "233 bar MA", colorDarkRed,
	//	styleLine+styleNoRescale+styleNoLabel);
}

// -- Create 0-initialized arrays the size of barcount
aHPivs = H - H;
aLPivs = L - L;
aHPivHighs = H - H;
aLPivLows = L - L;
aHPivIdxs = H - H;
aLPivIdxs = L - L;
aAddedHPivs = H - H;
aAddedLPivs = L - L;
aLegVol = H - H;
aRetrcVol = H - H;

nHPivs = 0;
nLPivs = 0;

lastHPIdx = 0;
lastLPIdx = 0;
lastHPH = 0;
lastLPL = 0;
curPivBarIdx = 0;

// -- looking back from the current bar, how many bars
//    back were the hhv and llv values of the previous
//    n bars, etc.?
aHHVBars = HHVBars(H, nBars);
aLLVBars = LLVBars(L, nBars);
aHHV = HHV(H, nBars);
aLLV = LLV(L, nBars);

// -- Initialize value of curTrend
nLastVisBar = LastValue(
	Highest(IIf(Status("barvisible"), BarIndex(), 0)));

curBar = IIf(nlastVisBar > 0 AND bUseLastVis, nlastVisBar,
	IIf(Status("action")==4 AND nExploreBarIdx > 0, nExploreBarIdx,
	LastValue(BarIndex())));

curTrend = "";
if (aLLVBars[curBar] < aHHVBars[curBar])
	curTrend = "D";
else
	curTrend = "U";

// -- Loop through bars. Search for
//    entirely array-based approach
//    in future version
/* *******************
	Find main pivots
******************* */

// -- Make sure there are enough bars!
if (curBar >= nNumBarsToScan) {
	for (i=0; i<nNumBarsToScan; i++) {

		// -- value of curBar dependent on two parameters
		curBar = IIf(nlastVisBar > 0 AND bUseLastVis,
			nlastVisBar-i,
			IIf(Status("action")==4 AND nExploreBarIdx > 0,
			nExploreBarIdx-i,
			LastValue(BarIndex())-i));

		// -- Have we identified a pivot? If trend is down...
		if (aLLVBars[curBar] < aHHVBars[curBar]) {

			// ... and had been up, this is a trend change
			if (curTrend == "U") {
				curTrend = "D";
				// -- Capture pivot information
				curPivBarIdx = curBar - aLLVBars[curBar];
				aLPivs[curPivBarIdx] = 1;
				aLPivLows[nLPivs] = L[curPivBarIdx];
				aLPivIdxs[nLPivs] = curPivBarIdx;
				nLPivs++;
			}
		// -- or current trend is up
		} else {
			if (curTrend == "D") {
				curTrend = "U";
				curPivBarIdx = curBar - aHHVBars[curBar];
				aHPivs[curPivBarIdx] = 1;
				aHPivHighs[nHPivs] = H[curPivBarIdx];
				aHPivIdxs[nHPivs] = curPivBarIdx;
				nHPivs++;
			}
		// -- 	If curTrend is up...else...
		}

	// -- loop through bars
	}
}
/* *******************
	Found main pivots
******************* */

/* *************************
	Finding missed pivot(s)
************************* */

// -- Start at last bar. Reestablish curBar
curBar =
	IIf(nlastVisBar > 0 AND bUseLastVis,
	nlastVisBar,
	IIf(Status("action")==4 AND nExploreBarIdx > 0,
	nExploreBarIdx,
	LastValue(BarIndex()))
	);

// -- Make sure I found at least two of each above.
if (nHPivs >= 2 AND nLPivs >= 2) {

	lastLPIdx = aLPivIdxs[0];
	lastLPL = aLPivLows[0];

	lastHPIdx = aHPivIdxs[0];
	lastHPH = aHPivHighs[0];

	nLastHOrLPivIdx = Max(lastLPIdx, lastHPIdx);

	nAddPivsRng = curBar - nLastHOrLPivIdx;
	aLLVAfterLastPiv = LLV(L, nAddPivsRng);
	nLLVAfterLastPiv = aLLVAfterLastPiv[curBar];
	aLLVIdxAfterLastPiv = LLVBars(L, nAddPivsRng);
	nLLVIdxAfterLastPiv = curBar - aLLVIdxAfterLastPiv[curBar];
	aHHVAfterLastPiv = HHV(H, nAddPivsRng);
	nHHVAfterLastPiv = aHHVAfterLastPiv[curBar];
	aHHVIdxAfterLastPiv = HHVBars(H, nAddPivsRng);
	nHHVIdxAfterLastPiv = curBar - aHHVIdxAfterLastPiv[curBar];

	// -- Later want to add last high pivot only if
	//    not in buy mode from last and still in trade

	/*
		Note - I'm only interested in adding pivots if I'm in
		a higher-highs or lower-lows scenario
	*/


	// -- OK, let's start where the last high pivot occurs after the
	//    last Low pivot
	if (lastHPIdx > lastLPIdx) {

		/*	There are at least two possibilities here. One is that
	   		the previous high was higher, indicating that this is a
	   		possible short retracement or one in the making.
	   		The other is that the previous high was lower, indicating
	   		that this is a possible long retracement in the working.
			However, both depend on opposing pivots. E.g., if I find
			higher highs, what if I have lower lows?

			If the highs are descending, then I can consider:
	   			- a lower low, and leave it at that
	   			- a higher high and higher low
	   			- a lower low and another lower high
		*/
		if (aHPivHighs[0] < aHPivHighs[1]) {

			if (nLLVAfterLastPiv < aLPivLows[0] AND
				(nLLVIdxAfterLastPiv - lastHPIdx - 1) >= nMinBarsBtwPivs
				AND nLLVIdxAfterLastPiv != curBar	) {

				// -- OK, we'll add this as a pivot.
				//    Mark it for plotting...
				aLPivs[nLLVIdxAfterLastPiv] = 1;
				aAddedLPivs[nLLVIdxAfterLastPiv] = 1;

				//    ...and then rearrange elements in the
				//    pivot information arrays
				for (j=0; j<nLPivs; j++) {
					aLPivLows[nLPivs-j] = aLPivLows[nLPivs-(j+1)];
					aLPivIdxs[nLPivs-j] = aLPivIdxs[nLPivs-(j+1)];
				}
				aLPivLows[0] = nLLVAfterLastPiv;
				aLPivIdxs[0] = nLLVIdxAfterLastPiv;
				nLPivs++;

			// -- Test whether to add piv given last piv is high
			//    AND we have lower highs
			}

		// -- Here, the last piv is a high piv, and we have
		//    higher-highs. The most likely addition is a
		//    Low piv that is a retracement.
		} else {

			if (nLLVAfterLastPiv > aLPivLows[0] AND
				(nLLVIdxAfterLastPiv - lastHPIdx - 1) >= nMinBarsBtwPivs
				AND nLLVIdxAfterLastPiv != curBar	) {

				// -- OK, we'll add this as a pivot.
				//    Mark it for plotting...
				aLPivs[nLLVIdxAfterLastPiv] = 1;
				aAddedLPivs[nLLVIdxAfterLastPiv] = 1;

				//    ...and then rearrange elements in the
				//    pivot information arrays
				for (j=0; j<nLPivs; j++) {
					aLPivLows[nLPivs-j] = aLPivLows[nLPivs-(j+1)];
					aLPivIdxs[nLPivs-j] = aLPivIdxs[nLPivs-(j+1)];
				}
				aLPivLows[0] = nLLVAfterLastPiv;
				aLPivIdxs[0] = nLLVIdxAfterLastPiv;
				nLPivs++;

			// -- Test whether to add piv given last piv is high
			//    AND we have lower highs
			}
		// -- The last piv is a high and we have higher highs
		//    OR lower highs
		}

	/* ****************************************************************
		Still finding missed pivot(s). Here, the last piv is a low piv.
	**************************************************************** */
	} else {

		// -- First case, lower highs
		if (aHPivHighs[0] < aHPivHighs[1]) {

			if (nHHVAfterLastPiv < aHPivHighs[0] AND
				(nHHVIdxAfterLastPiv - lastLPIdx - 1) >= nMinBarsBtwPivs
				AND nHHVIdxAfterLastPiv != curBar	) {

				// -- OK, we'll add this as a pivot.
				//    Mark that for plotting
				aHPivs[nHHVIdxAfterLastPiv] = 1;
				aAddedHPivs[nHHVIdxAfterLastPiv] = 1;

				//    ...and then rearrange elements in the
				//    pivot information arrays
				for (j=0; j<nHPivs; j++) {
					aHPivHighs[nHPivs-j] = aHPivHighs[nHPivs-(j+1)];
					aHPivIdxs[nHPivs-j] = aHPivIdxs[nhPivs-(j+1)];
				}
				aHPivHighs[0] = nHHVAfterLastPiv;
				aHPivIdxs[0] = nHHVIdxAfterLastPiv;
				nHPivs++;

			// -- Test whether to add piv given last piv is high
			//    AND we have lower highs
			}

		// -- Second case when last piv is a low piv, higher highs
		//    Most likely addition is high piv that is a retracement.
		//    Considering adding a high piv as long as it is higher
		} else {

			// -- Where I have higher highs,
			if (nHHVAfterLastPiv > aHPivHighs[0] AND
				(nHHVIdxAfterLastPiv - lastLPIdx - 1) >= nMinBarsBtwPivs
				AND nHHVIdxAfterLastPiv != curBar	) {

				// -- OK, we'll add this as a pivot.
				//    Mark it for plotting...
				aHPivs[nHHVIdxAfterLastPiv] = 1;
				aAddedHPivs[nHHVIdxAfterLastPiv] = 1;

				//    ...and then rearrange elements in the
				//    pivot information arrays
				for (j=0; j<nHPivs; j++) {
					aHPivHighs[nHPivs-j] = aHPivHighs[nHPivs-(j+1)];
					aHPivIdxs[nHPivs-j] = aHPivIdxs[nhPivs-(j+1)];
				}
				aHPivHighs[0] = nHHVAfterLastPiv;
				aHPivIdxs[0] = nHHVIdxAfterLastPiv;
				nHPivs++;

			// -- Test whether to add piv given last piv is high
			//    AND we have lower highs
			}

		}

	}

// -- If there are at least two of each
}

/* ****************************************
// -- Done with finding pivots
***************************************** */

if (bDraw) {

	// -- OK, let's plot the pivots using arrows
	PlotShapes(
		IIf(aHPivs==1, shapeDownArrow, shapeNone),
			colorRed, 0, 	High, Offset=-15);
	PlotShapes(
		IIf(aAddedHPivs==1, shapeDownArrow, shapeNone),
			colorDarkRed, 0, High, Offset=-15);
	PlotShapes(
		IIf(aLPivs==1, shapeUpArrow , shapeNone),
			colorGreen, 0, Low, Offset=-15);
	PlotShapes(
		IIf(aAddedLPivs==1, shapeUpArrow , shapeNone),
			colorDarkGreen, 0, Low, Offset=-15);
}

/* ****************************************
// -- Done with discovering and plotting pivots
***************************************** */

// -- I'm going to want to look for possible retracement
risk = 0;
profInc = 0;
nLeg0Pts = 0;
nLeg0Bars = 0;
nLeg0Vol = 0;
nLeg1Pts = 0;
nLeg1Bars = 0;
nLeg1Vol = 0;
nLegBarsDiff = 0;
nRtrc0Pts = 0;
nRtrc0Bars = 0;
nRtrc0Vol = 0;
nRtrc1Pts = 0;
nRtrc1Bars = 0;
nRtrc1Vol = 0;

minRtrc = 0;
maxRtrc = 0;
minLine = 0;
maxLine = 0;
triggerLine = 0;
firstProfitLine = 0;
triggerInc = 0;
triggerPrc = 0;
firstProfitPrc = 0;
retrcPrc = 0;
retrcBar = 0;
retrcBarIdx = 0;
retrcRng = 0;
aRetrcPrc = H-H;
aRetrcPrcBars = H-H;
aRetrcClose = C;
retrcClose = 0;

// -- Do TCZ calcs. Arrangement of pivs very specific
//    for this setup.
if (nHPivs >= 2 AND
	nLPivs >=2 AND
	aHPivHighs[0] > aHPivHighs[1] AND
	aLPivLows[0] > aLPivLows[1]) {

	tcz500 =
	(aHPivHighs[0] -
	(.5 * (aHPivHighs[0] - aLPivLows[1])));

	tcz618 =
	(aHPivHighs[0] -
	(.618 * (aHPivHighs[0] - aLPivLows[1])));

	tcz786 =
	(aHPivHighs[0] -
	(.786 * (aHPivHighs[0] - aLPivLows[0])));

	retrcRng = curBar  - aHPivIdxs[0];
	aRetrcPrc = LLV(L, retrcRng);
	aRetrcPrcBars  = LLVBars(L, retrcRng);

	retrcPrc = aRetrcPrc[curBar];
	retrcBarIdx = curBar - aRetrcPrcBars[curBar];
	retrcClose = aRetrcClose[retrcBarIdx];

	// -- bTCZLong setup?
	bTCZLong = (

		// -- Are retracement levels arranged in
		//    tcz order?

		// .500 is above .786 for long setups
		tcz500 >= (tcz786 * (1 - tczTolerance))
		AND
		// .681 is below .786 for long setups
		tcz618 <= (tcz786 * (1 + tczTolerance))
		AND

		// -- Is the low in the tcz range
		// -- Is the close >= low of tcz range
		//    and low <= high of tcz range
		retrcClose >= ((1 - retrcTolerance) *  tcz618)
		AND
		retrcPrc <= ((1 + retrcTolerance) *  tcz500)
		);

		// -- risk would be high of signal bar minus low of zone
		//risk = 0;

// -- lower highs and lower lows
} else if (nHPivs >= 2 AND nLPivs >=2
	AND aHPivHighs[0] < aHPivHighs[1]
	AND aLPivLows[0] < aLPivLows[1]) {

	tcz500 =
	(aHPivHighs[1] -
	(.5 * (aHPivHighs[1] - aLPivLows[0])));

	tcz618 =
	(aHPivHighs[0] -
	(.618 * (aHPivHighs[1] - aLPivLows[0])));

	tcz786 =
	(aHPivHighs[0] -
	(.786 * (aHPivHighs[0] - aLPivLows[0])));

	retrcRng = curBar  - aLPivIdxs[0];
	aRetrcPrc = HHV(H, retrcRng);
	retrcPrc = aRetrcPrc[curBar];
	aRetrcPrcBars  = HHVBars(H, retrcRng);
	retrcBarIdx = curBar - aRetrcPrcBars[curBar];
	retrcClose = aRetrcClose[retrcBarIdx];

	bTCZShort = (
		// -- Are retracement levels arranged in
		//    tcz order?

		// .500 is below .786 for short setups
		tcz500 <= (tcz786 * (1 + tczTolerance))
		AND
		// .681 is above .786 for short setups
		tcz618 >= (tcz786 * (1 - tczTolerance))
		AND

		// -- Is the close <= high of tcz range
		//    and high >= low of tcz range
		retrcClose <= ((1 + retrcTolerance) *  tcz618)
		AND
		retrcPrc >= ((1 - retrcTolerance) *  tcz500)
		);

		// -- Risk would be top of zone - low of signal bar
		//risk = 0;
}

// -- Show zone if present
if (bTCZShort OR bTCZLong) {

	// -- Be prepared to see symmetry
	if (bTCZShort) {
		if (aLPivIdxs[0] > aHPivIdxs[0]) {
			// -- Valuable, useful symmetry information
			nRtrc0Pts = aHPivHighs[0] - aLPivLows[1];
			nRtrc0Bars = aHPivIdxs[0] - aLPivIdxs[1] + 1;
			nRtrc1Pts = retrcPrc - aLPivLows[0];
			nRtrc1Bars = retrcBarIdx - aLPivIdxs[0] + 1;
		} else {
			nRtrc0Pts = aHPivHighs[1] - aLPivLows[1];
			nRtrc0Bars = aHPivIdxs[1] - aLPivIdxs[1] + 1;
			nRtrc1Pts = aHPivHighs[0] - aLPivLows[0];
			nRtrc1Bars = aHPivIdxs[0] - aLPivIdxs[0] + 1;
		}
	} else { // bLongSetup
		if (aLPivIdxs[0] > aHPivIdxs[0]) {
			nRtrc0Pts = aHPivHighs[0] - aLPivLows[1];
			nRtrc0Bars = aHPivIdxs[0] - aLPivIdxs[1] + 1;
			nRtrc1Pts = retrcPrc - aLPivLows[0];
			nRtrc1Bars = retrcBarIdx - aLPivIdxs[0] + 1;
		} else {
			nRtrc0Pts = aHPivHighs[1] - aLPivLows[0];
			nRtrc0Bars = aLPivIdxs[0] - aHPivIdxs[1] + 1;
			nRtrc1Pts = aHPivHighs[0] - aLPivLows[0];
			nRtrc1Bars = aLPivIdxs[0] - aHPivIdxs[0] + 1;
		}
	}

	if (bShowTCZ) {
		Plot(
			LineArray(	IIf(bTCZLong, aHPivIdxs[0], aLPivIdxs[0]),
			tcz500, curBar, tcz500 , 0),
			"tcz500", colorPaleBlue, styleLine);
		Plot(
			LineArray(	IIf(bTCZLong, aHPivIdxs[0], aLPivIdxs[0]),
			tcz618, curBar, tcz618, 0),
			"tcz618", colorPaleBlue, styleLine);
		Plot(
			LineArray(	IIf(bTCZLong, aHPivIdxs[0], aLPivIdxs[0]),
			tcz786, curBar, tcz786, 0),
			"tcz786", colorTurquoise, styleLine);
	}

// -- if (bShowTCZ)
}

if (bDraw) {
	Title = Name() + " (" + StrLeft(FullName(), 10) +
	")  ATR: " + NumToStr(ATR(1), 4.2) + " ( " +
	NumToStr((C - Ref(C, -1)), 4.2) + " / " +
	NumToStr((((C - Ref(C, -1)) / Ref(C, -1)) * 100), 2.1) + 	"% )  " +
	WriteVal( SelectedValue( DateTime() ), formatDateTime) +
	" \nO: " + Open +
	",  \nH: " + High +
	",  \nL: " + Low +
	", \nC: " + Close + 	",  \n" +
//	"Risk: " + WriteVal(risk, 2.1) + "%  \n" +
	"Rtrc 0/1 Pts: " + WriteVal(nRtrc0Pts, 2.1) + "/" +
	WriteVal(nRtrc1Pts, 2.1) + "  \n" +
	"Rtrc 0/1 Bars: " + WriteVal(nRtrc0Bars, 2.0) + "/" +
	WriteVal(nRtrc1Bars, 2.0);
}

// **************************
// END INDICATOR CODE
// **************************
4 comments
Leave Comment
Please login here to leave a comment.
look nice
Can this indicator be modified to run as an explorer to identify main pivots (as in the code above) on EOD data for the last few bars?
Tried modifying but always get
aHPivs,aAddedHPivs,aLPivs and aAddedLPivs as zero value.what time frame use for crudeoil
does anyone have this for backtest ?
@kaiji, please reply, I wanted to ask you about your code