MA Crossover with Pivot Sup/Res Level for Amibroker (AFL)
chitrabaski over 12 years ago Amibroker (AFL)
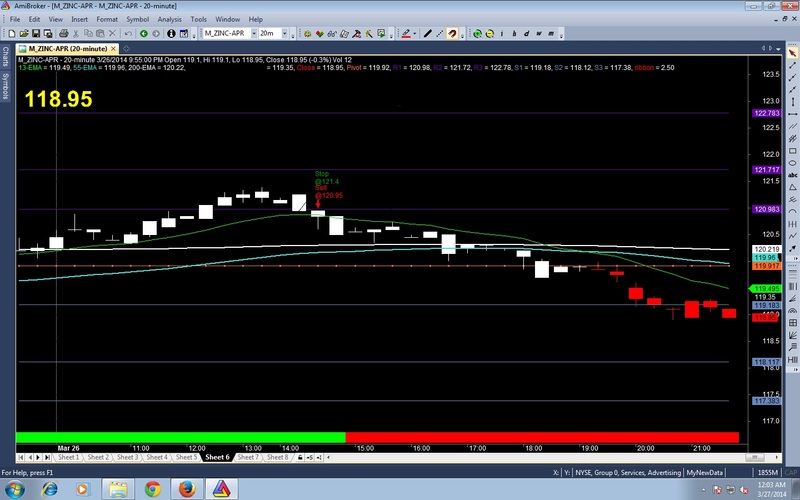
This is modified AFL by me. EMA 5, 12 and 34, with Pivot Levels and support/resistanace levels also available. Swing Trend Ribbon with 20 minutes times followed.
Screenshots
Indicator / Formula
Copy & Paste Friendly
_SECTION_BEGIN("MA Crossover Unicolor");

Plot(EMA(Close,13),"13-EMA",colorBrightGreen,1);
Plot(EMA(Close,55),"55-EMA",colorTurquoise,4);
Plot(EMA(Close,200),"200-EMA",colorWhite,4);

r=EMA(C,13);
a=EMA(C,55);


no=Param( "Swing", 5, 1, 55 );

res=HHV(H,no);
sup=LLV(L,no);
tsl=IIf(ValueWhen(IIf(C>Ref(res,-1),1,IIf(C<Ref(sup,-1),-1,0))!=0,IIf(C>Ref(res,-1),1,IIf(C<Ref(sup,-1),-1,0)),1)==1,sup,res);

Plot(tsl, _DEFAULT_NAME(), colorBlack, styleLine, styleThick);
Buy = Cross(C,res) ;
Sell = Cross(sup,C)  ;
//PlotShapes (IIf(Buy,shapeUpArrow,shapeNone),colorYellow,0,Graph0,-15);
//PlotShapes (IIf(Sell,shapeDownArrow,shapeNone),colorCustom12,0,Graph0,-15);

_SECTION_END();

//GfxDrawText("5 period high low system", 4,12, 250, 40);

_SECTION_BEGIN("Price");
SetChartOptions(0,chartShowArrows|chartShowDates);

Plot( C, "Close", IIf(r>a,colorWhite,IIf(a>=r,colorRed,colorBlack)), styleCandle | styleThick );
_SECTION_END();
a=C;
g=(EMA(Close,13) * (2 / 4 - 1)-EMA(Close,55) * (2 / 6 - 1)) / (2 /4- 2 /6);
e=Ref(tsl,-1);
Buy = Cross(C,tsl) ;
Sell = Cross(tsl,C)  ;
SellPrice=ValueWhen(Sell,e,1);
BuyPrice=ValueWhen(Buy,e,1);
Long=Flip(Buy,Sell);
Shrt=Flip(Sell,Buy );
Filter=Buy OR Sell;
Buy = Cross(C,tsl) ;
Sell = Cross(tsl,C)  ;
shape = Buy * shapeUpArrow + Sell * shapeDownArrow;

PlotShapes( shape, IIf( Buy, colorWhite, colorRed ),0, IIf( Buy, Low, High ) );
a1=Ref(tsl,-1);
GraphXSpace = 15;
dist = 1.5*ATR(5);
for( i = 0; i < BarCount; i++ )
{if( Buy[i] ) PlotText( "Buy\n@" + a1[ i ], i, L[ i ]-dist[i], colorWhite );
if( Sell[i] ) PlotText( "Sell\n@" + a1[ i ], i, H[ i ]+dist[i],
colorRed);
}

GraphXSpace = 15;
dist = 2.5*ATR(5);
for( i = 0; i < BarCount; i++ )
{if( Buy[i] ) PlotText( "Stop\n@" + tsl[ i ], i, L[ i ]-dist[i], colorRed );
if( Sell[i] ) PlotText( "Stop\n@" + tsl[ i ], i, H[ i ]+dist[i],
colorGreen);
}
AddColumn( IIf( Buy, 66, 83 ), "Signal", formatChar );
AddColumn(C,"close",1.2);
AddColumn(e,"trade price",1.2);
gd=(Ref(EMA(C,5),-1)*(1-.3333)-Ref(EMA(C,3),-1)*(1-.5))/(.5-.3333);
zd=(EMA(Close,3) * (2 / 4 - 1) - EMA(Close,5) * (2 / 6 - 1)) / (2 / 4 -2 /6);
Cond0=EMA(C,3)>EMA(C,5);
NR7 = (Ref(H,-1) - Ref(L,-1)) < Ref(LLV(H-L,7),-1);
V1=V;
V2=Ref(V,-1);
Title = EncodeColor(colorWhite) +  Name() + " - " + EncodeColor(colorWhite)+ Interval(2)  +
 "  - " + Date() +" - " +EncodeColor(colorWhite) +"Open-"+O+"  "+"High-"+H+"  "+"Low-"+L+"  "+
"Close-"+C+"  "+ "Vol= "+ WriteVal(V,1.0)+"    "+"Lot Size "+WriteVal(RoundLotSize,1.0)+"  Margin   "+WriteVal(MarginDeposit,1.0)+
"\n"+ " Todays Vol = "+WriteVal(V1,1.0)+" Ydays Vol = "+WriteVal(V2,1.0)+"\n"+
 "3ema= "+ WriteVal(EMA(C,3),1.2)+"    "+ "5ema= "+ WriteVal(EMA(C,5),1.2)+"\n"+
 "5 period reversal=  "+ WriteVal(tsl,1.2)+"\n"+
EncodeColor(colorWhite)+
WriteIf (Buy , " GO LONG / Reverse Signal at "+e+"  ","")+
WriteIf (Sell , " EXIT LONG / Reverse Signal at "+e+"  ","")+"\n"+EncodeColor(colorRed)+
WriteIf(Sell , "Total Profit/Loss for the Last Trade Rs."+(C-BuyPrice)+"","")+
WriteIf(Buy  , "Total Profit/Loss for the Last trade Rs."+(SellPrice-C)+"","")+EncodeColor(colorBlue)+
WriteIf(Long AND NOT Buy, "Trade : Long - Entry price Rs."+(BuyPrice),"")+EncodeColor(colorRed)+
WriteIf(shrt AND NOT Sell, "Trade : Short - Entry price Rs."+(SellPrice),"")+"\n"+EncodeColor(colorBlue)+
WriteIf(Long AND NOT Buy, "Current Profit/Loss Rs."+(C-BuyPrice)+"","")+
WriteIf(shrt AND NOT Sell, "Current Profit/Loss Rs."+(SellPrice-C)+"","")+
"\n"+ " Today's Reversal @ "+WriteVal(e,1.2);
AlertIf( Buy, "SOUND C:\\Windows\\Media\\notify.wav", "Audio alert", 1,2,1 );
AlertIf( Sell, "SOUND C:\\Windows\\Media\\notify.wav", "Audio alert", 2,2,1 );

GfxSelectFont("Tahoma", Status("SwingSystem")/12 );
GfxSetTextAlign(6.5 );// center alignment
GfxSetTextColor( ColorHSB( 42, 42, 42 ) );
GfxSetBkMode(0); // transparent
GfxTextOut( " " +Close, Status("pxwidth")/2, Status("pxheight")/8 );
GfxSetTextColor( ColorHSB( 42, 42, 42 ) );
TimeFrameSet(inDaily);
V1=V;
V2=Ref(V,-1);
V3=LLV(L,250);
OI1=Ref(OI,-1);
OI2=(OI-OI1)/1000;
L1=LLV(L,250);
L2=L;
H1=H;
Oa=Open;
Ha=High;
La=Low;
Cond11=Oa==Ha;
Cond12=Oa==La;
TimeFrameRestore();

_SECTION_BEGIN("OLH");
GfxSetOverlayMode(0);
GfxSelectFont("Tahoma", Status("pxheight")/15 );
GfxSetTextAlign(6.5 );// center alignment
GfxSetTextColor( ColorHSB( 42, 42, 42 ) );
GfxSetBkMode(0); // transparent
GfxTextOut( WriteIf(Cond11, "  Open=High     "," "), Status("pxwidth")/1.3, Status("pxheight")/1.25 );
GfxTextOut( WriteIf(Cond12, " Open=Low    "," "), Status("pxwidth")/1.3, Status("pxheight")/1.25 );

_SECTION_BEGIN("New formula 2");
SetChartOptions(0,chartShowArrows|chartShowDates);
_N(Title = StrFormat("{{NAME}} - {{INTERVAL}} {{DATE}} Open %g, Hi %g, Lo %g, Close %g (%.1f%%) Vol " +WriteVal( V, 1.0 ) +"
{{VALUES}}", O, H, L, C, SelectedValue( ROC( C, 1 )) ));
H1=SelectedValue( TimeFrameGetPrice( "H", inDaily, -1 ));
L1=SelectedValue(TimeFrameGetPrice( "L", inDaily, -1 ));
C1=SelectedValue(TimeFrameGetPrice( "C", inDaily, -1 ));
/*PIVOT Calculation*/
p = ( H1+ L1 + C1 )/3;
s1 = (2*p)-H1;
r1 = (2*p)-L1;
s2 = p -(H1 - L1);
s3 = S1 - (H1-L1);
r2 = p +(H1 - L1);
r3 = R1 +(H1-L1);

Plot (p,"Pivot",25,styleDots);
Plot (r1,"R1",12,1);
Plot (r2,"R2",12,1);
Plot (r3,"R3",12,1);
Plot (s1,"S1",3,1);
Plot (s2,"S2",3,1);
Plot (s3,"S3",3,1);
X=Cross(C,p);
Z=Cross(p,C);
//xxxxxxxxxxxxxxxxxxxxxxxxxxxxxxxxxxxxxxxxxxxxxxxxxxxxxxxxxxxxxxxxxxxxxxxxxxxxxxxxxxxxxxxxxxxxxxxxxxxxxxxxxx

_SECTION_END();
_SECTION_END();

//RSI RIBBON

// Drag-and-drop the code on to your price chart

//xxxxxxxxxxxxxxxxxxxxxxxxxxxxxxxxxxxxxxxxxxxxxxxxxxxxxxxxxxxxxxxxxxxxxxxxxxxxxxxxxxxxxxxxxxxxxxxxxxxxxxxxxxxxxxxxxxxxxxxxxxx

//=== Didi Index ===

_SECTION_BEGIN("Background");
//SetChartBkGradientFill(ParamColor("Top", colorTeal), ParamColor("Bottom", colorLightGrey), ParamColor("Title", colorTeal));
//SetChartBkColor(ParamColor("Chart Background", colorWhite));
_SECTION_END();

_SECTION_BEGIN("Didi Index Indicator");
function DidiIndex( Curta, Media, Longa )
{
 global DidiLonga, DidiCurta;
 DidiLonga = MA( Close, Longa ) - MA( Close, Media );
 DidiCurta = MA( Close, Curta ) - MA( Close, Media );

 return IIf(DidiCurta > 0 AND DidiLonga < 0, 1,IIf(DidiCurta<0 AND DidiLonga>0, -1,0));
}

MAFast = Optimize("Curta",Param("MA Curta",3,1,5 ),1,5,1);
MAMid  = Optimize("Media",Param("MA Média",8,6,12),6,12,1);
MASlow = Optimize("Longa",Param("MA Longa",20,15,34),15,34,1);

Trend = DidiIndex(MAFast, MAMid, MASlow);
//Buy = Cross(Trend,0) AND ADX()>MDI();
//Sell = Cross(0,Trend);
//Buy = ExRem(Buy,Sell); Sell = ExRem(Sell,Buy);

//TrendColor = IIf(DidiCurta>0,colorBrightGreen,colorRed);

//Plot( DidiCurta, _DEFAULT_NAME(), TrendColor, ParamStyle("Histogram style", styleThick | styleHistogram | styleNoLabel, maskHistogram ));
//Plot(0,"", colorBrown ,styleLine);

//Plot(DidiLonga,"",IIf(DidiLonga<0,colorGreen,colorRed),styleLine | styleThick);

//Plot(DidiCurta,"",IIf(DidiCurta>0,colorBrightGreen,colorRed),styleLine | styleThick);

//Normal Buy and Sell Signal
//PlotShapes(Buy*shapeSmallUpTriangle,colorBlue,0,-0.5);
//PlotShapes(Sell*shapeSmallDownTriangle,colorPink,0,0.5);

// The Best Signal: Didi Needleful
//PlotShapes((Cross(DidiCurta,0) AND Cross(0,DidiLonga)) * shapeHollowCircle, colorYellow,0,0.25);
_SECTION_END();


//===== Didi Ribbon ======

Uptrend= didicurta>0;
downtrend= didicurta<0;

Plot( 2.5, /* defines the height of the ribbon in percent of pane width */"ribbon",
IIf( uptrend, colorBrightGreen, IIf( downtrend, colorRed, 0 )), /* choose color */
styleOwnScale|styleArea|styleNoLabel, -0.5, 100 );

//========================

_SECTION_BEGIN("Magnified Market Price");
//by Vidyasagar, vkunisetty@yahoo.com//
FS=Param("Font Size",30,30,100,1);
GfxSelectFont("Arial", FS, 900, italic = False, underline = False, True );
GfxSetBkMode( colorWhite );
GfxSetTextColor( ParamColor("Color",colorYellow) );
//Hor=Param("Horizontal Position",800,800,800,800);

Hor=Param("Horizontal Position",20,20,500,20);


Ver=Param("Vertical Position",50,50,250,50);
GfxTextOut(""+C,Hor , Ver );
YC=TimeFrameGetPrice("C",inDaily,-1);
_SECTION_END();
0 comments
Leave Comment
Please login here to leave a comment.